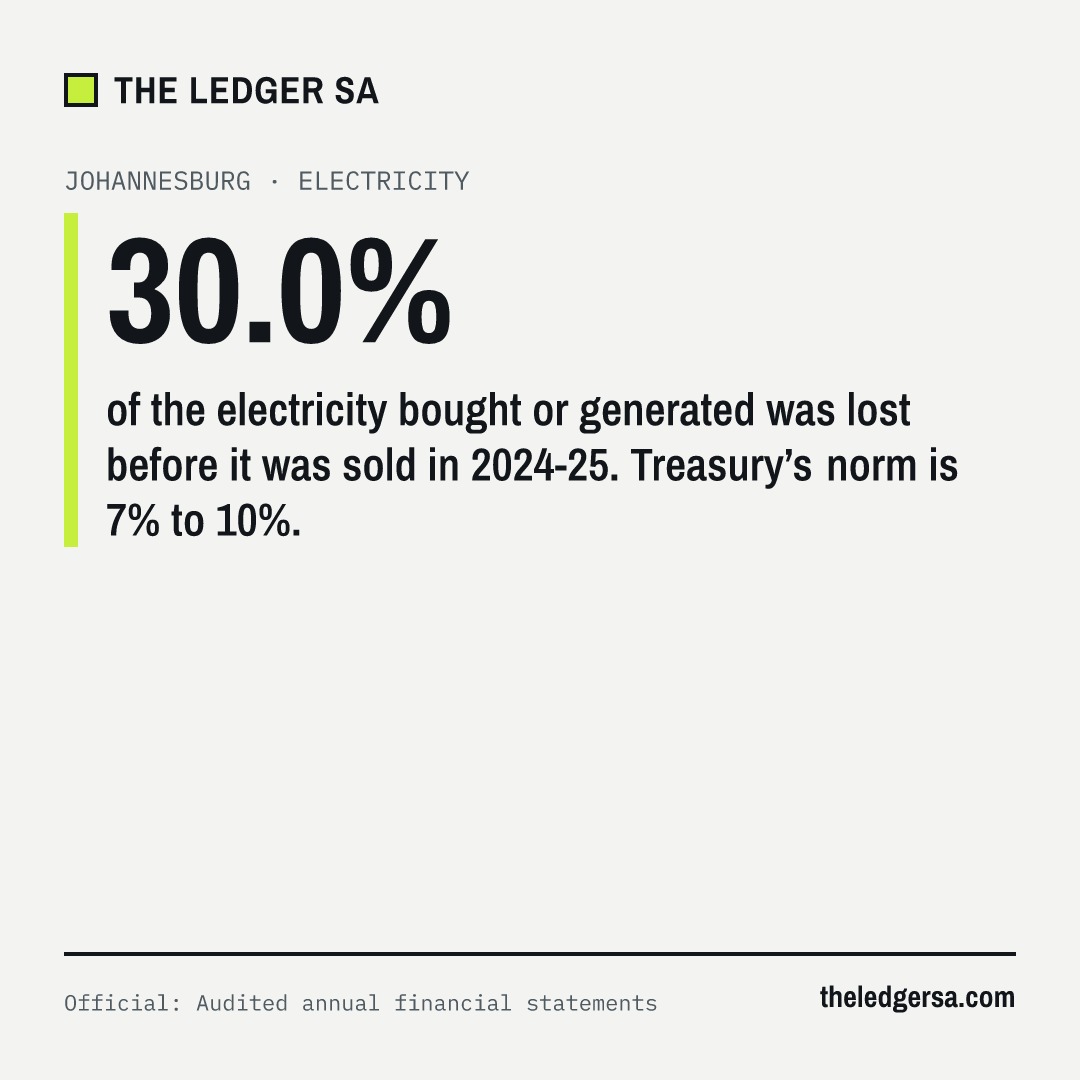
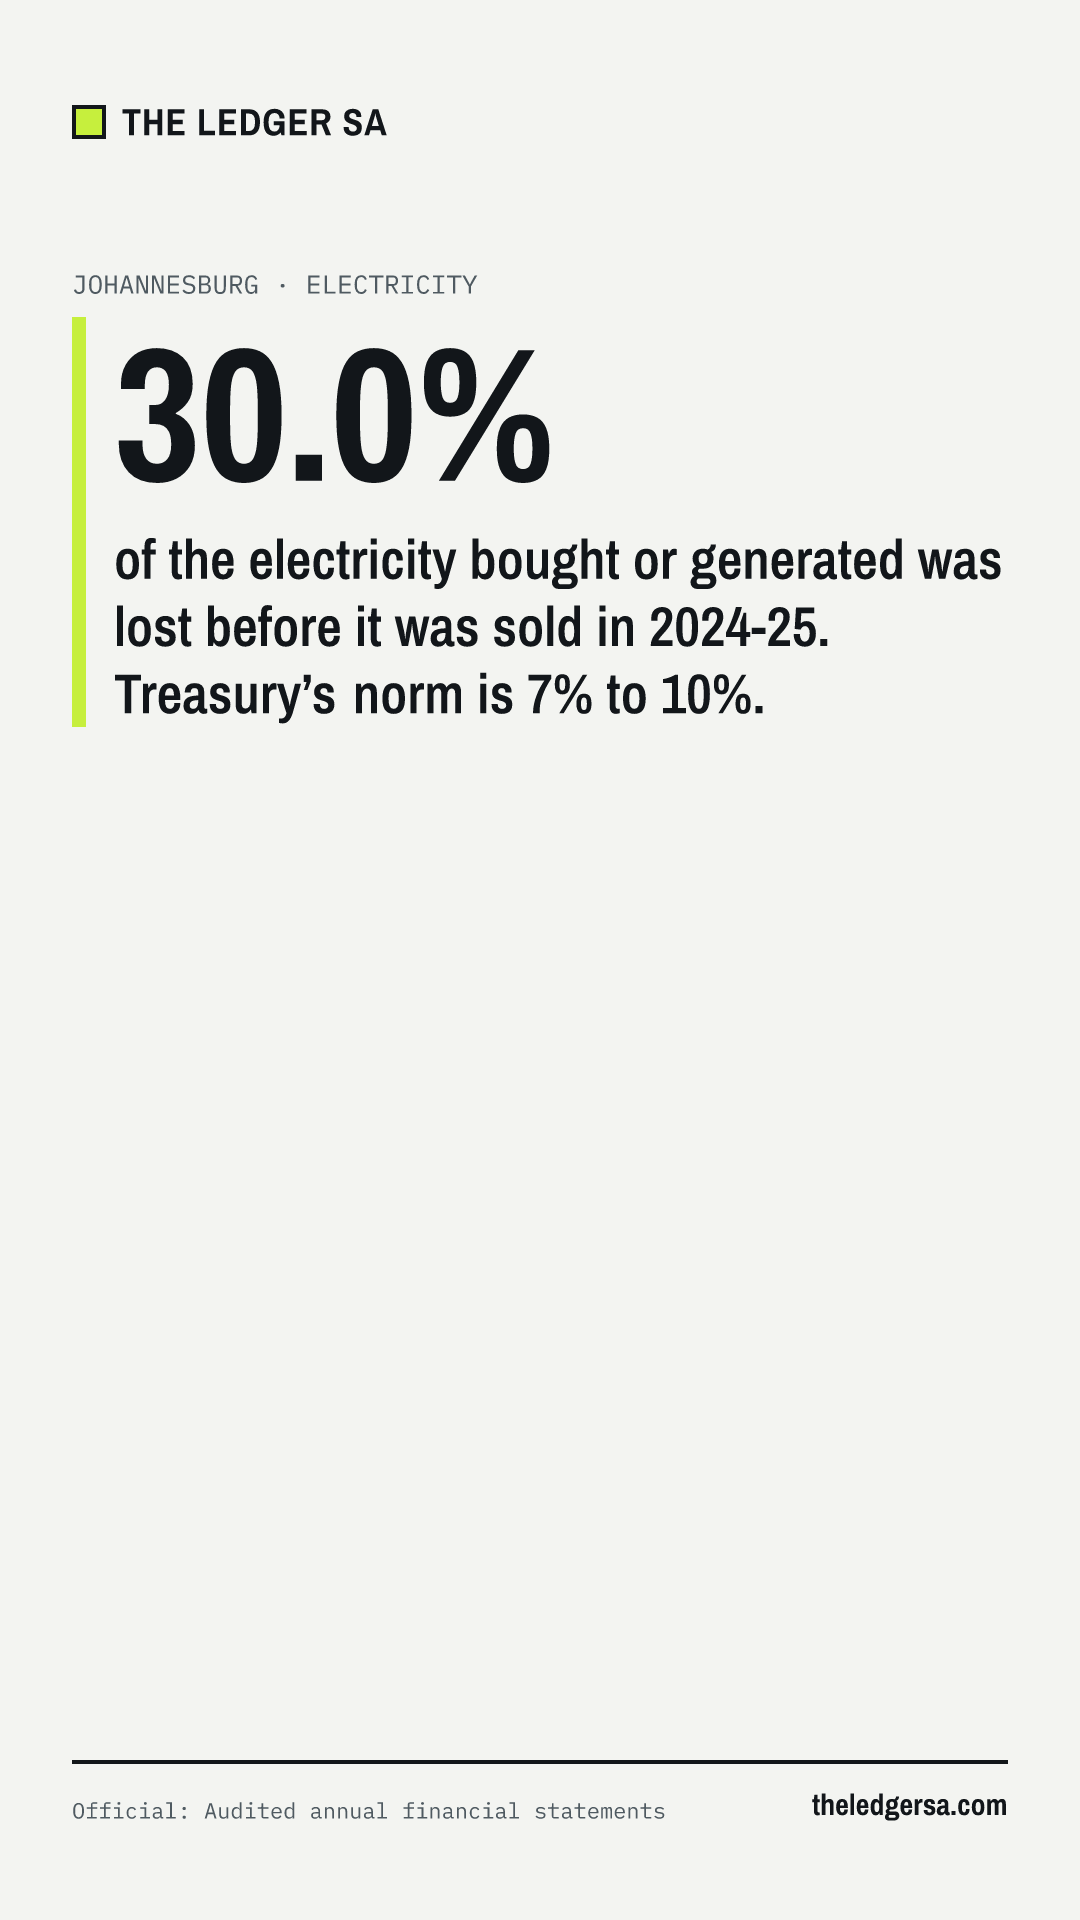
Treasury norm: 7% to 10%
Share of electricity bought or generated that is lost before it is sold.
Note: includes the metro’s utility company.
Source: Johannesburg’s audited annual financial statements.
Electricity · Gauteng
How often is it off? Who produces our power?
30.0%
of the electricity bought or generated was lost before it was sold in 2024-25. Treasury’s norm is 7% to 10%.
Official: Audited annual financial statements · Data as of 2024-25 financial year (audited statements) · Next update expected Jan 2027 (2025-26 annual reports) · Last updated
Compare all eight metros: Electricity. An asterisk marks a figure our automated checks found inconsistent with another official figure; it is shown as reported, explained in a footnote and left out of rankings.
Official: audited annual financial statements · Data as of 2024-25 financial year (audited statements) · Next update expected Jan 2027 (2025-26 annual reports) · Last updated
Electricity a metro buys or generates but never bills: technical losses in the network, theft and faulty meters. Treasury’s norm is 7% to 10%.
Treasury norm: 7% to 10%
Share of electricity bought or generated that is lost before it is sold.
Note: includes the metro’s utility company.
Source: Johannesburg’s audited annual financial statements.
Official: City Power (Johannesburg's electricity utility), outage notifications · Data as of see each notice’s date · Updates: checked daily · Last updated
692 power interruption notices from Johannesburg since 1 Jan 2025; 498 named places we could match to wards.
Places are matched by their Stats SA Census 2011 names, longest name first, with no guessing; a name we cannot match is listed for checking and not linked to a ward. Notices before 1 Jan 2025 are not included. Where a metro publishes no notices, residents can report an outage (community reports, unverified).
6 948 hours in 2023, against 1 656 hours in 2024. It last happened on 26 Mar 2024, by the CSIR’s count.
Independent source: CSIR Energy Centre, Utility-scale power generation statistics in South Africa 2024, page 69. The CSIR estimates these from Eskom’s announcements; not an official statistic, and not used in our rankings. The report. Data as of 2024 (latest annual report) · Updates: the CSIR publishes once a year.