The Ledger SA

All eight metros

Money in

Where does the metro’s money come from?

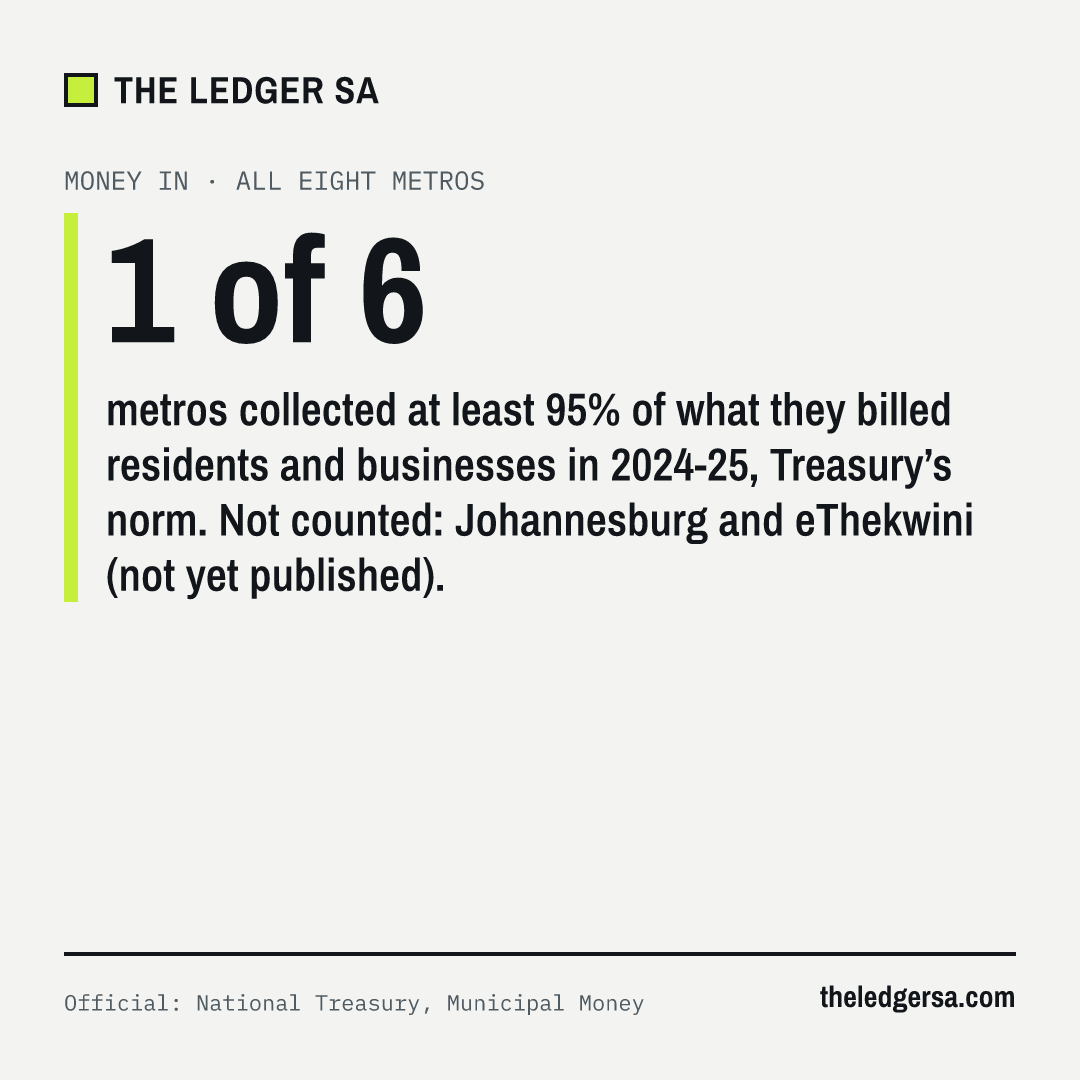
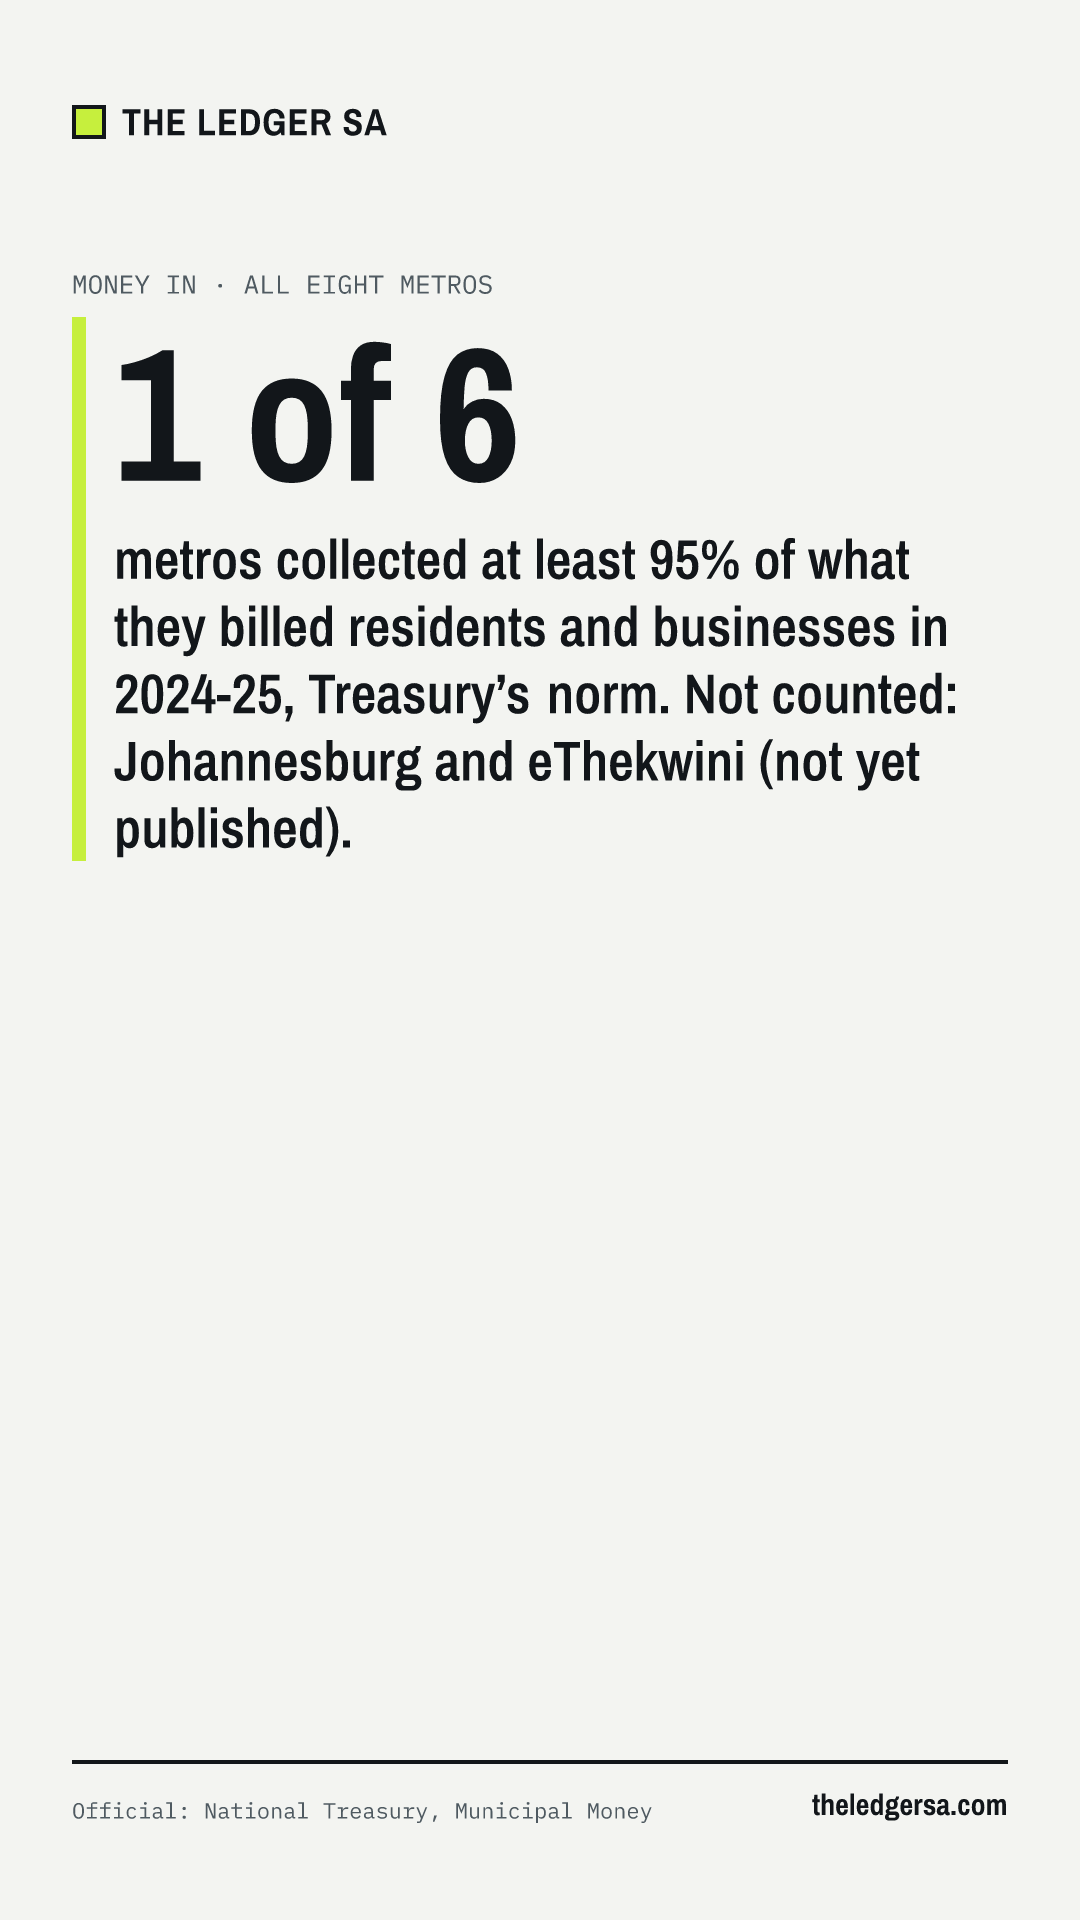
1 of 6

metros collected at least 95% of what they billed residents and businesses in 2024-25, Treasury’s norm. Not counted: Johannesburg and eThekwini (not yet published).

Official: National Treasury, Municipal Money · Data as of 2024-25 financial year (audited) · Last updated

An asterisk marks a figure our automated checks found inconsistent with another official figure. It is shown as reported, explained in a footnote and left out of rankings.

Where the money comes from

Metros do not get income tax or VAT. Those go to national government.

A metro’s own money comes from property rates (a tax on property value) and from selling services: electricity, water, sanitation and refuse removal. On top of that, national government sends grants, mostly for building infrastructure and for free basic services to poor households.

So a metro’s finances depend heavily on one thing: collecting what it bills.

Collecting what it bills

Official: National Treasury · Data as of 2024-25 financial year (audited) · Last updated

What these words mean
Property rates
A yearly tax on property, based on its municipal valuation. It is the metro’s main tax.
Collection rate
How much of what the metro billed residents and businesses in the year was actually paid.
Grants
Money national government sends to metros, mostly for building infrastructure and free basic services.
Treasury norm
A target National Treasury sets for every municipality in MFMA Circular 71, so metros can be compared on the same scale.
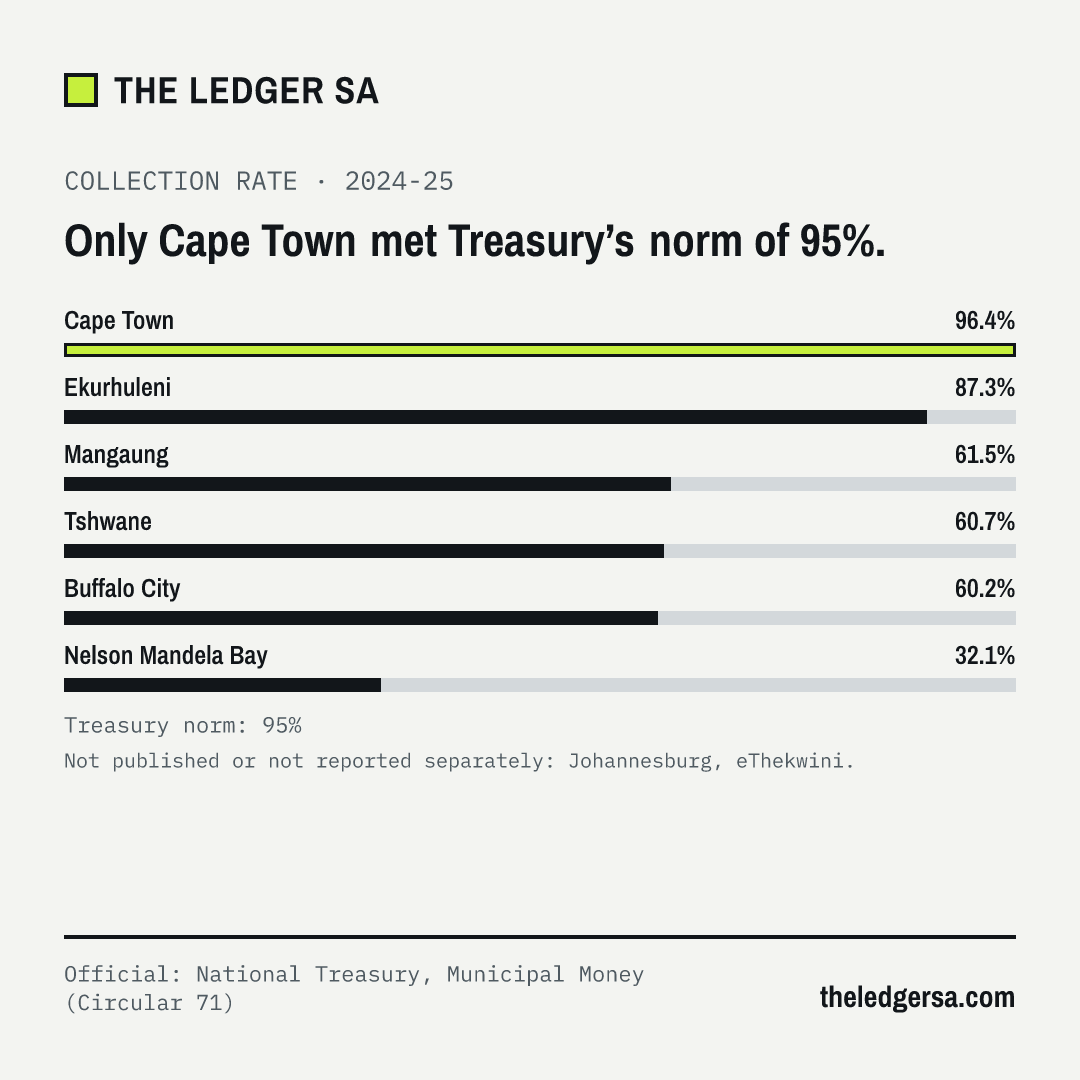
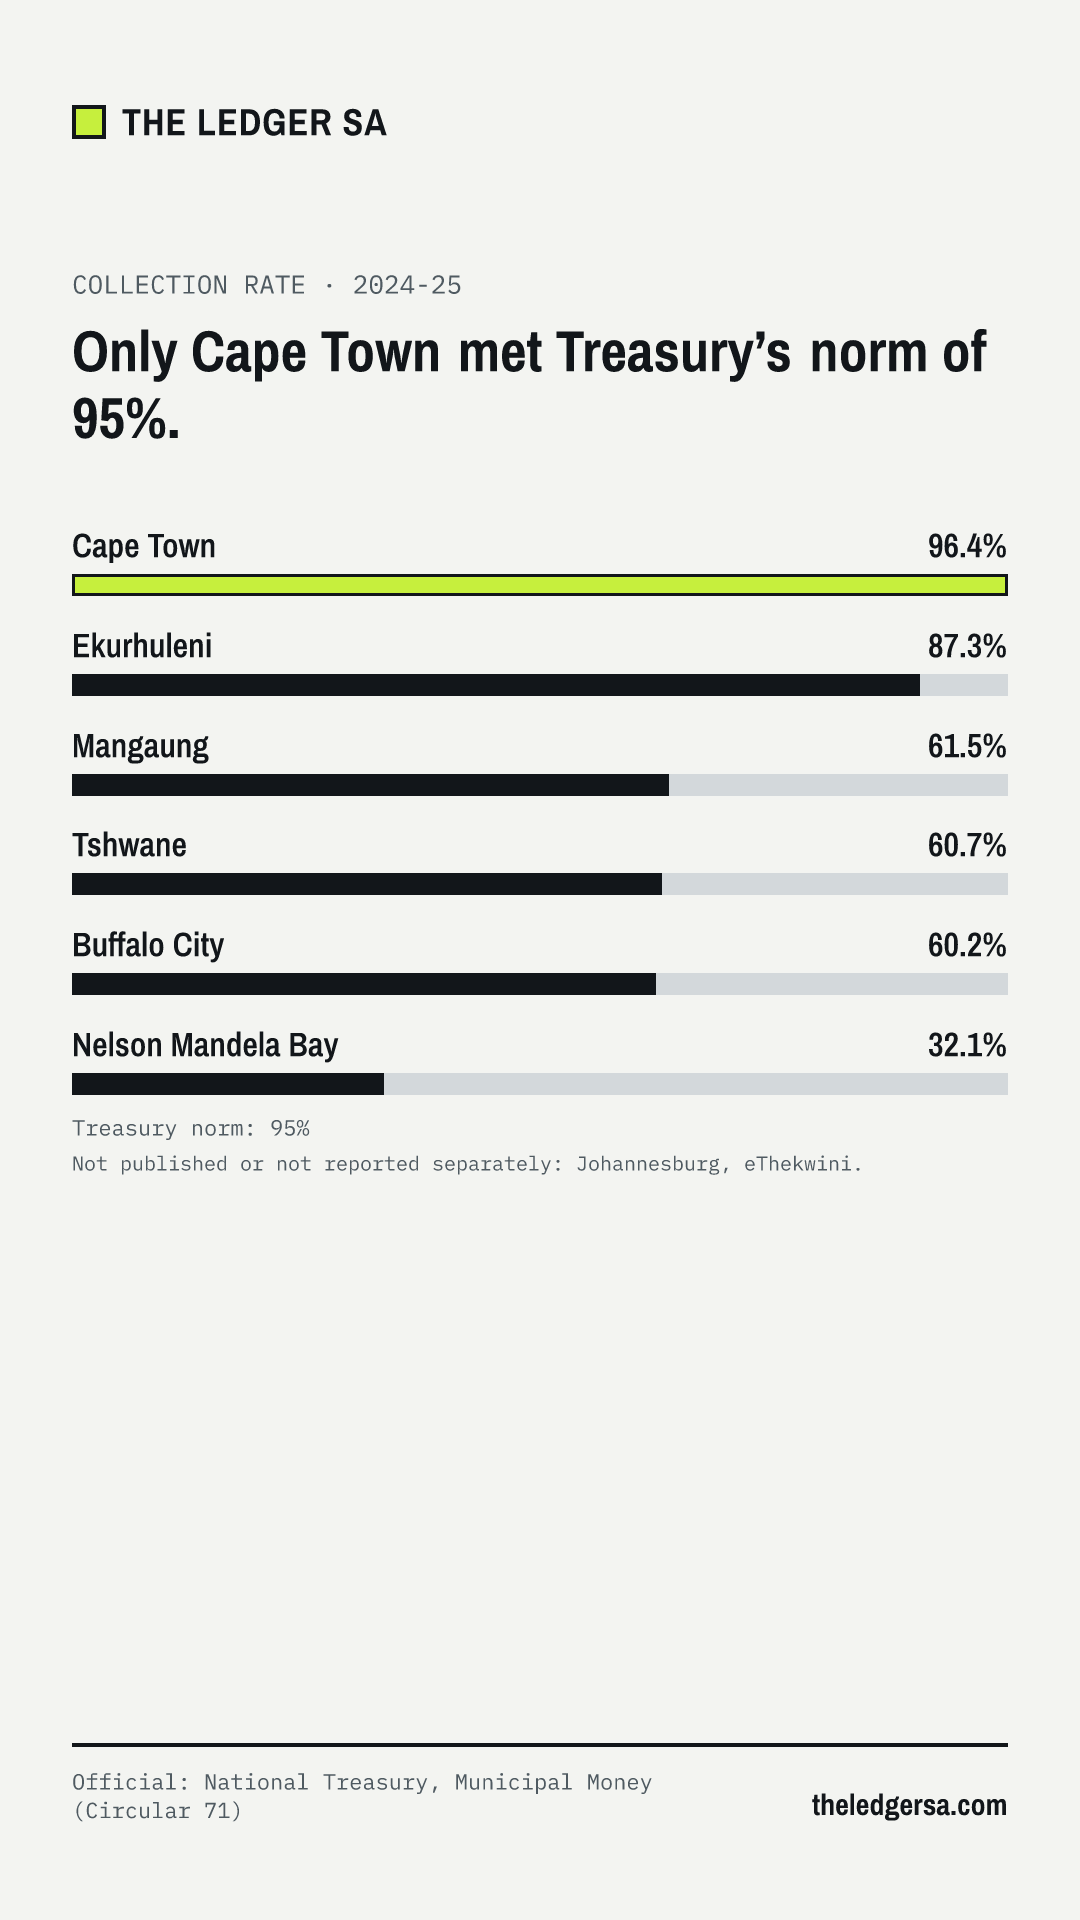
Collection rate · 2024-25

96.4%

Only Cape Town met Treasury’s norm of 95%. Share of the rates and service charges billed in the year that was actually collected.

  1. Cape Town96.4%
  2. Ekurhuleni87.3%
  3. Mangaung61.5%
  4. Tshwane60.7%
  5. Buffalo City60.2%
  6. Nelson Mandela Bay32.1%
  7. JohannesburgNot yet published
  8. eThekwiniNot yet published

Treasury norm (Circular 71): 95%. The thin lines on the bars mark it.

Source: National Treasury, Municipal Money. Each figure links to its exact query. Calculated with the Circular 71 formula (see How we work).

2025-26, unaudited: operating revenue

Official: National Treasury, Section 71 (unaudited) · Data as of 30 June 2026 (2025-26, 12 of 12 months, unaudited) · Next update expected November 2026 (Treasury’s next quarterly Section 71 release)

Operating revenue as a share of the adjusted budget · 2025-26, 12 months

111%

Highest: Johannesburg.

  1. Johannesburg111%R93.80bn of R84.85bn
  2. Cape Town101%R72.61bn of R71.83bn
  3. eThekwini101%R61.94bn of R61.44bn
  4. Buffalo City98%R10.75bn of R10.92bn
  5. Tshwane98%R52.38bn of R53.66bn
  6. Ekurhuleni96%R63.58bn of R66.33bn
  7. Nelson Mandela Bay95%R18.16bn of R19.12bn
  8. Mangaung93%R10.82bn of R11.63bn

Official: National Treasury, Section 71 2025-26 quarter 4 (unaudited). Unaudited figures as each metro reported them; audited figures follow about six months after the year ends.

Unaudited: what each metro reported to National Treasury for the full year (preliminary) of 2025-26, to 30 June 2026. The audited years stay the reference; these figures are not used in headlines. Source: Treasury’s summary of metros workbook (all files).

Money in, by source

Official: National Treasury, Municipal Money (audited) · Data as of 2024-25 financial year (audited) · Last updated

Selling electricity brings in more than any other source in all 8 metros with figures for 2023-24.

What these words mean
Property rates
A yearly tax on property, based on its municipal valuation. It is the metro’s main tax.
Grants
Money national government sends to metros, mostly for building infrastructure and free basic services.
Fuel levy share
Part of the national tax on petrol and diesel, which national government shares with the metros.
  • Electricity sales
  • Property rates
  • Water sales
  • Sanitation charges
  • Refuse charges
  • Operating grants
  • Fuel levy share
  • Everything else

Johannesburg R71.19bn · R12 301 per resident

Electricity sales 26% · Property rates 24% · Water sales 13%

Tshwane R45.86bn · R11 685 per resident

Electricity sales 34% · Property rates 22% · Water sales 13%

Ekurhuleni R51.64bn · R13 091 per resident

Electricity sales 38% · Property rates 17% · Operating grants 12%

Cape Town R61.84bn · R12 562 per resident

Electricity sales 32% · Everything else 19% · Property rates 19%

eThekwini R54.91bn · R12 883 per resident

Electricity sales 31% · Property rates 23% · Water sales 13%

Nelson Mandela Bay R16.34bn · R12 899 per resident

Electricity sales 30% · Water sales 19% · Property rates 18%

Buffalo City R9.35bn · R10 713 per resident

Electricity sales 26% · Property rates 23% · Operating grants 15%

Mangaung R9.46bn · R11 050 per resident

Electricity sales 35% · Property rates 15% · Water sales 14%

Operating revenue, not counting grants for building infrastructure. Per resident uses Stats SA’s mid-year population estimates. Source: National Treasury, Municipal Money, income and expenditure (audited actuals) (one query per metro; this link is for Cape Town).

Money owed to the metros

Official: National Treasury, Municipal Money (unaudited monthly returns) · Data as of Mar 2026 (unaudited monthly returns) · Updates: Treasury adds months quarterly · Last updated

What these words mean
Money owed to the metro
Unpaid bills for rates, electricity, water, sanitation, refuse and other charges, from households, businesses and government.
Older than 90 days
Bills unpaid for more than three months. The older a debt, the less likely the metro is to collect it.
Owed to the metro · Mar 2026

R73.92bn

Johannesburg is owed the most.

  1. JohannesburgR73.92bn90% older than 90 days
  2. eThekwiniR44.56bn86% older than 90 days
  3. EkurhuleniR37.56bn81% older than 90 days
  4. TshwaneR32.43bn85% older than 90 days
  5. Nelson Mandela BayR25.38bn85% older than 90 days
  6. MangaungR11.33bn87% older than 90 days
  7. Buffalo CityR10.00bn86% older than 90 days
  8. Cape TownR9.20bn63% older than 90 days

Official: National Treasury, Municipal Money, aged debtors (monthly returns, unaudited). Everything residents, businesses and government owe the metro for rates and services.

Money the metros owe suppliers

Official: National Treasury, Municipal Money (unaudited monthly returns) · Data as of Mar 2026 (unaudited monthly returns) · Updates: Treasury adds months quarterly

Owed by the metro to suppliers · Mar 2026

R8.99bn

Highest: Johannesburg.

  1. JohannesburgR8.99bn28% older than 90 days
  2. TshwaneR5.11bn39% older than 90 days
  3. EkurhuleniR2.49bn0% older than 90 days
  4. MangaungR1.66bn60% older than 90 days
  5. Nelson Mandela BayR1.52bn92% older than 90 days
  6. Buffalo CityR1.17bn0% older than 90 days
  7. eThekwiniR768.2m3% older than 90 days
  8. Cape Town−R110.0m*1not ranked

Official: National Treasury, Municipal Money, aged creditors (monthly returns, unaudited). Treasury’s norm is to pay within 30 days.

  • *1 As reported to National Treasury (monthly return, Mar 2026). This figure is inconsistent with the nature of money owed to suppliers, which cannot be negative and may be a reporting error.

Income tax and the metro’s own money

Official: SARS and National Treasury · Data as of tax year 2024 (provisional) · Updates: SARS and Treasury publish once a year · Last updated

Metros do not receive income tax or VAT. Income tax goes to national government. Part of national revenue flows back to municipalities as grants: the equitable share and grants for set purposes. A metro’s own money comes from property rates and charges for electricity, water, sanitation and refuse.

The figures below put three things side by side for each metro. They cover different periods: a tax year runs from 1 March to the end of February; a municipal year runs from 1 July to 30 June. The periods overlap but are not the same.

What these words mean
Income tax assessed
The personal income tax SARS worked out from the tax returns of people who live in the metro. It is paid to national government, not to the metro.
Own revenue
Money a metro raises itself: property rates and charges for electricity, water, sanitation and refuse removal.
Transfers received
Money national and provincial government gave the metro in the year: the equitable share for running costs and free basic services, and grants for set purposes such as infrastructure.
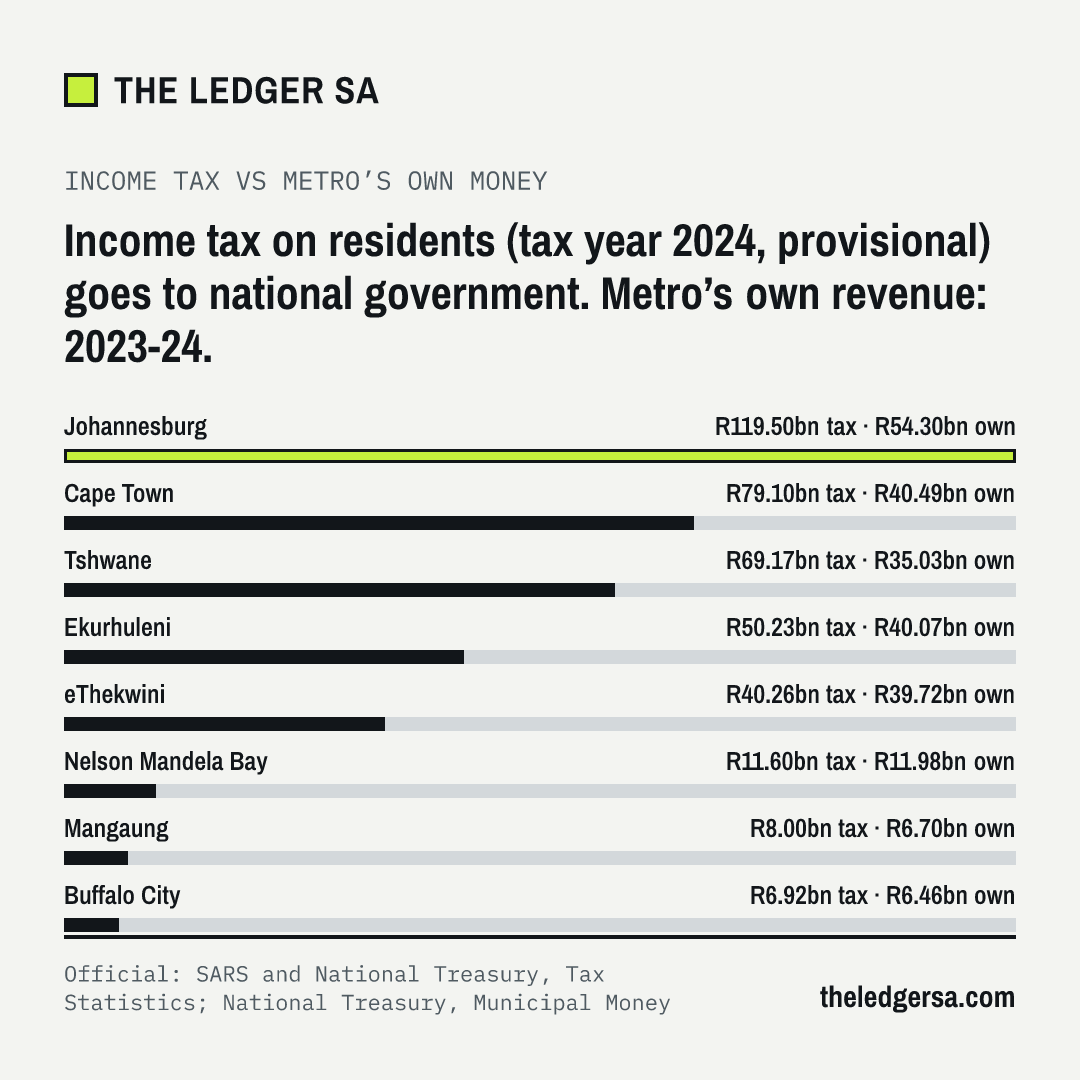
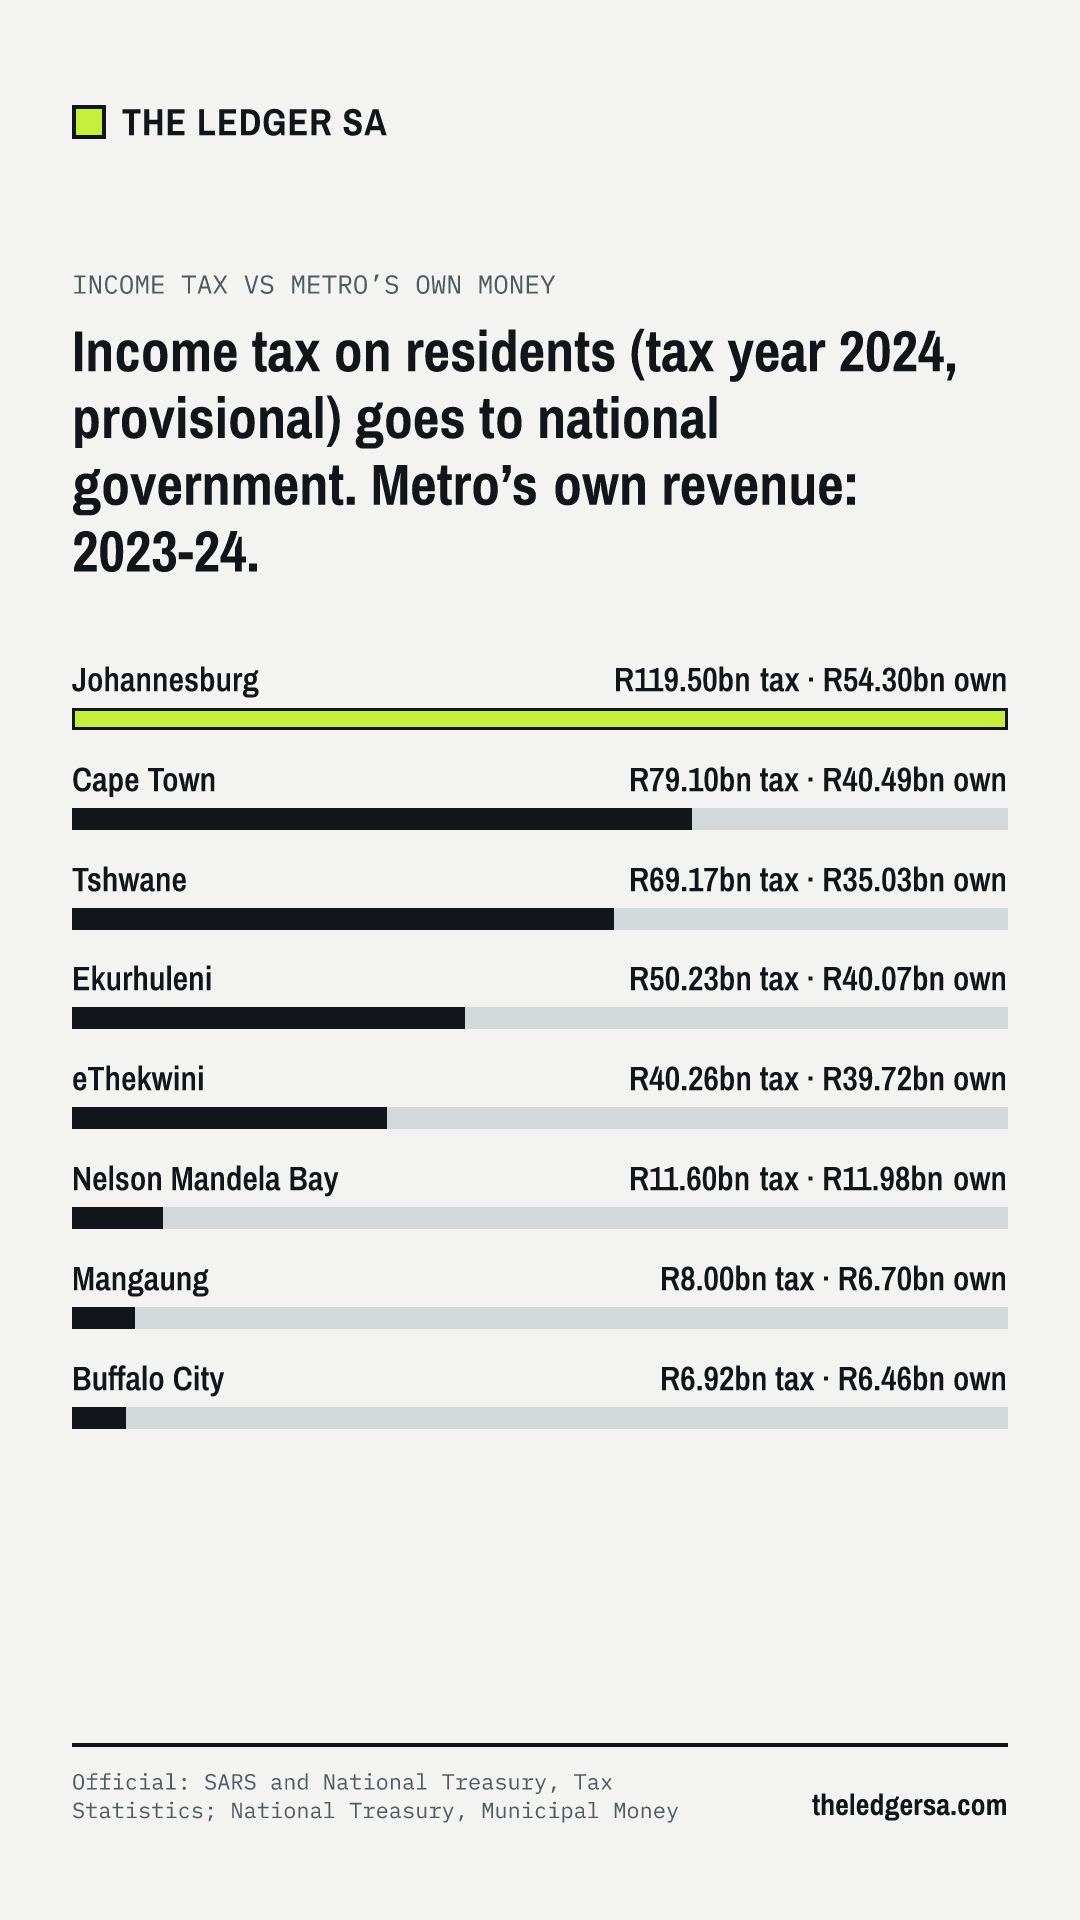
  • Income tax assessed on residents (tax year 2024, provisional)
  • Metro’s own revenue (2023-24)
  • Transfers received (2023-24)

Johannesburg

R119.50bn income tax · R20 649 per resident
R54.30bn own revenue · R9 382 per resident
R10.68bn transfers received · R1 845 per resident

970 892 assessed taxpayers · average taxable income R480 318

Tshwane

R69.17bn income tax · R17 622 per resident
R35.03bn own revenue · R8 925 per resident
R6.44bn transfers received · R1 642 per resident

750 274 assessed taxpayers · average taxable income R412 120

Ekurhuleni

R50.23bn income tax · R12 736 per resident
R40.07bn own revenue · R10 159 per resident
R8.65bn transfers received · R2 194 per resident

689 698 assessed taxpayers · average taxable income R353 030

Cape Town

R79.10bn income tax · R16 068 per resident
R40.49bn own revenue · R8 225 per resident
R9.26bn transfers received · R1 880 per resident

975 779 assessed taxpayers · average taxable income R370 992

eThekwini

R40.26bn income tax · R9 446 per resident
R39.72bn own revenue · R9 318 per resident
R10.07bn transfers received · R2 362 per resident

667 629 assessed taxpayers · average taxable income R312 686

Nelson Mandela Bay

R11.60bn income tax · R9 160 per resident
R11.98bn own revenue · R9 456 per resident
R2.84bn transfers received · R2 245 per resident

203 830 assessed taxpayers · average taxable income R312 909

Buffalo City

R6.92bn income tax · R7 922 per resident
R6.46bn own revenue · R7 401 per resident
R2.26bn transfers received · R2 589 per resident

123 402 assessed taxpayers · average taxable income R311 180

Mangaung

R8.00bn income tax · R9 344 per resident
R6.70bn own revenue · R7 835 per resident
R1.84bn transfers received · R2 153 per resident

136 040 assessed taxpayers · average taxable income R324 008

Income tax: tax year 2024 (1 Mar 2023 to 29 Feb 2024); provisional: The latest tax year in each edition is incomplete: it holds only the assessments finished when SARS extracted the data, and the next edition revises it upwards. We use each tax year from the newest edition that has it. Metro figures: municipal year 2023-24 (1 Jul 2023 to 30 Jun 2024), audited. Own revenue is property rates plus charges for electricity, water, sanitation and refuse. Transfers received are operating and capital transfers from national and provincial government, as recognised in the audited statements. Per resident uses Stats SA’s mid-year population estimate for 2024.
Sources: SARS and National Treasury, Tax Statistics, Chapter 2 Personal Income Tax, tables A2.10.1 to A2.10.9 (assessed individual taxpayers, by the residential address declared on their tax returns); National Treasury, Municipal Money, income and expenditure (audited). Not published by ward.