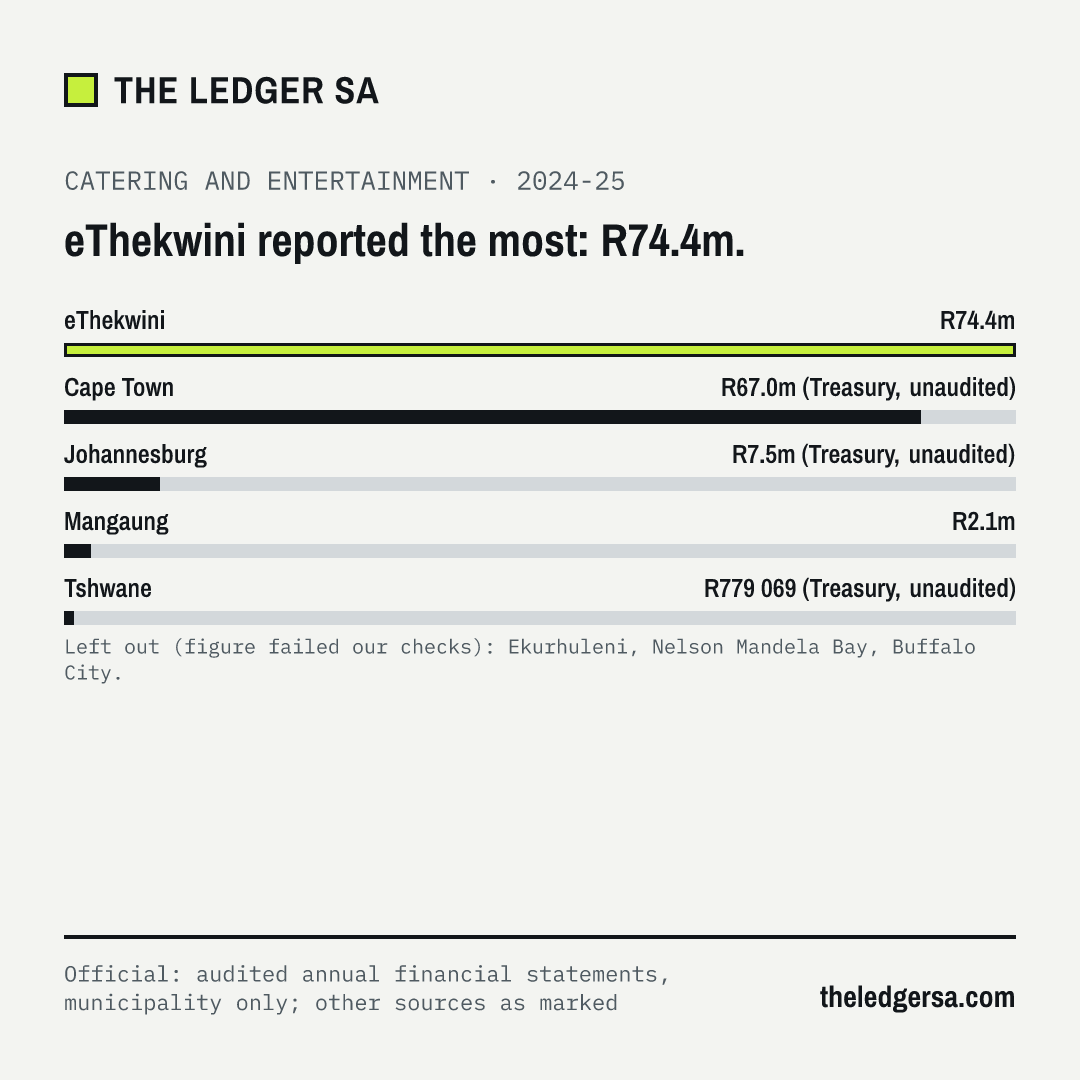
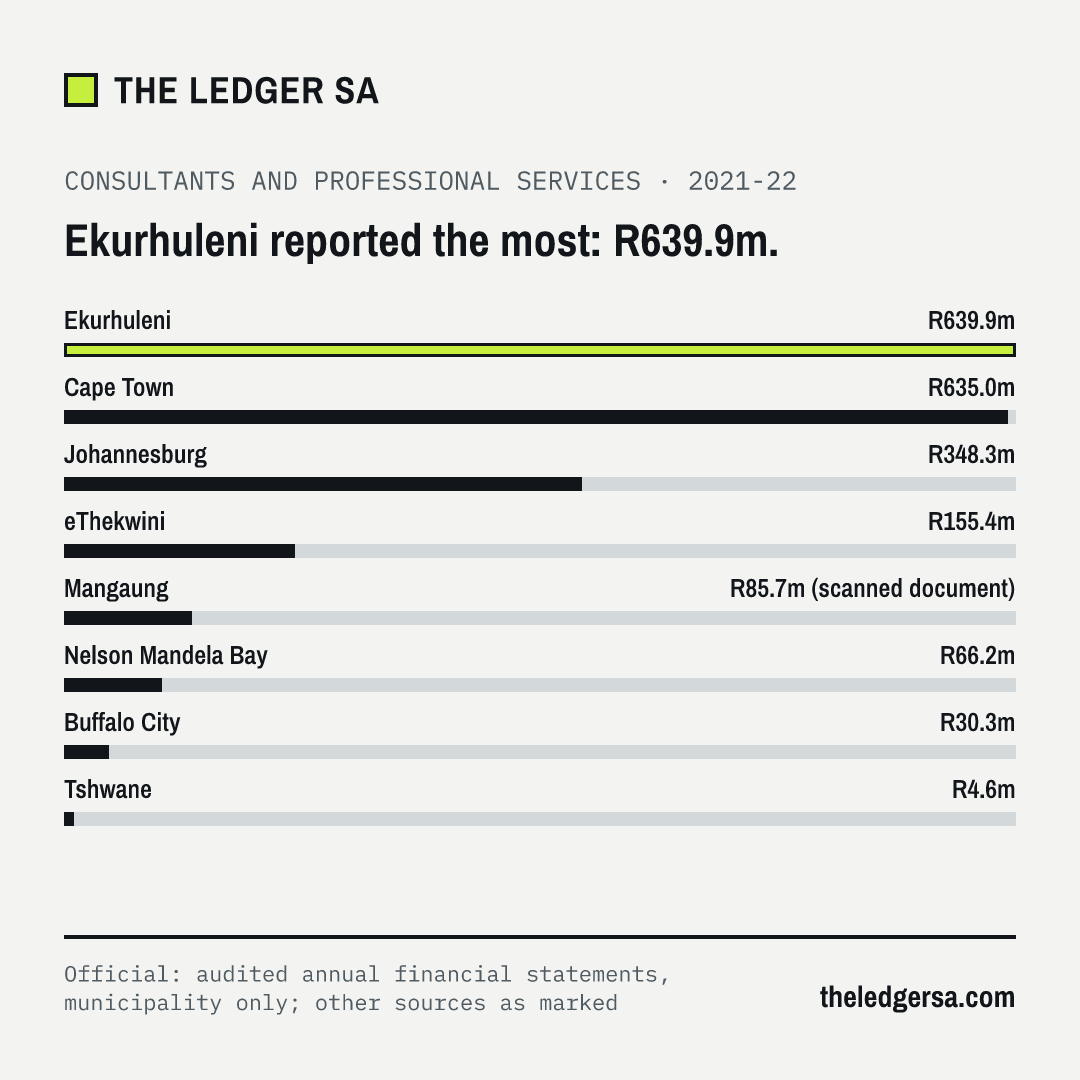
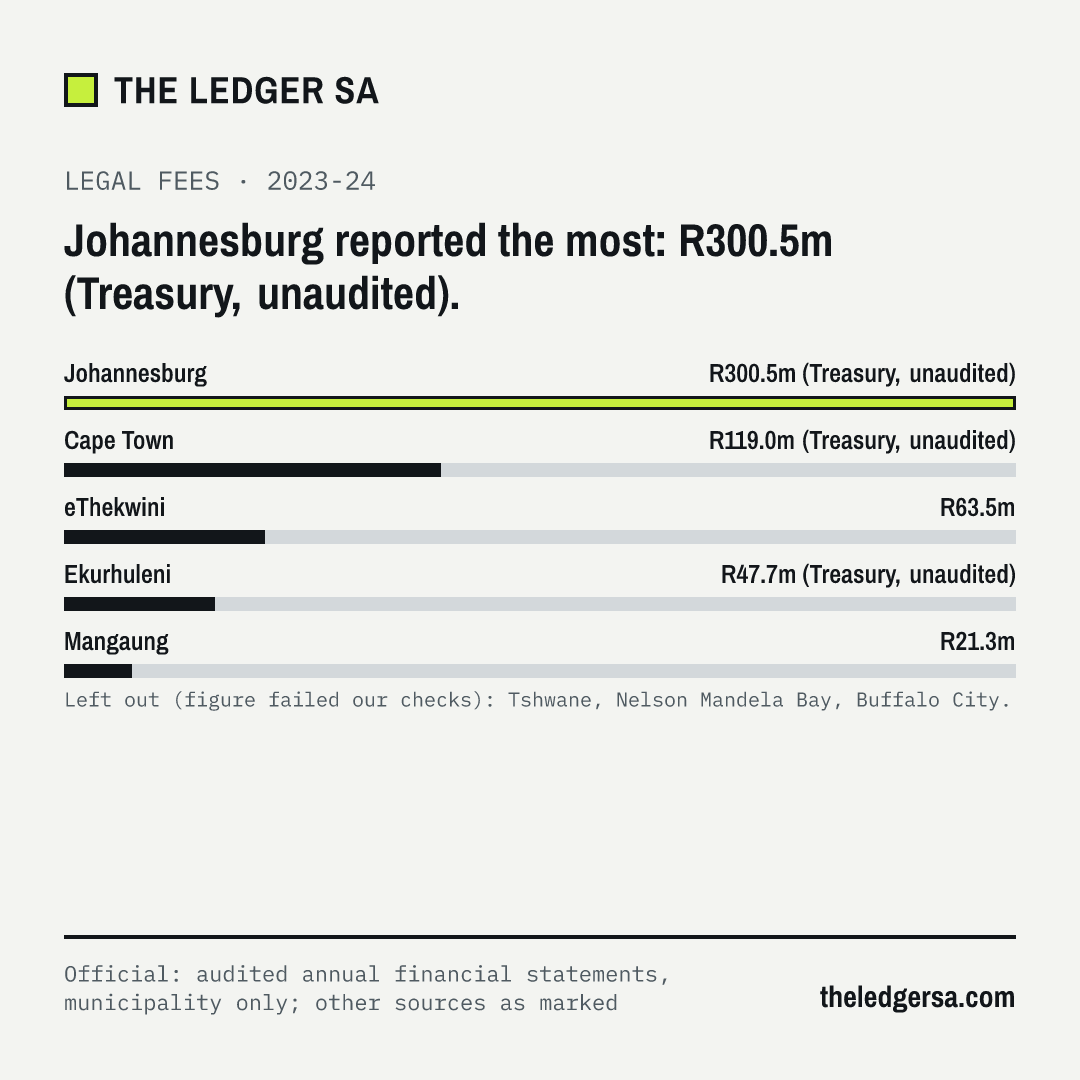
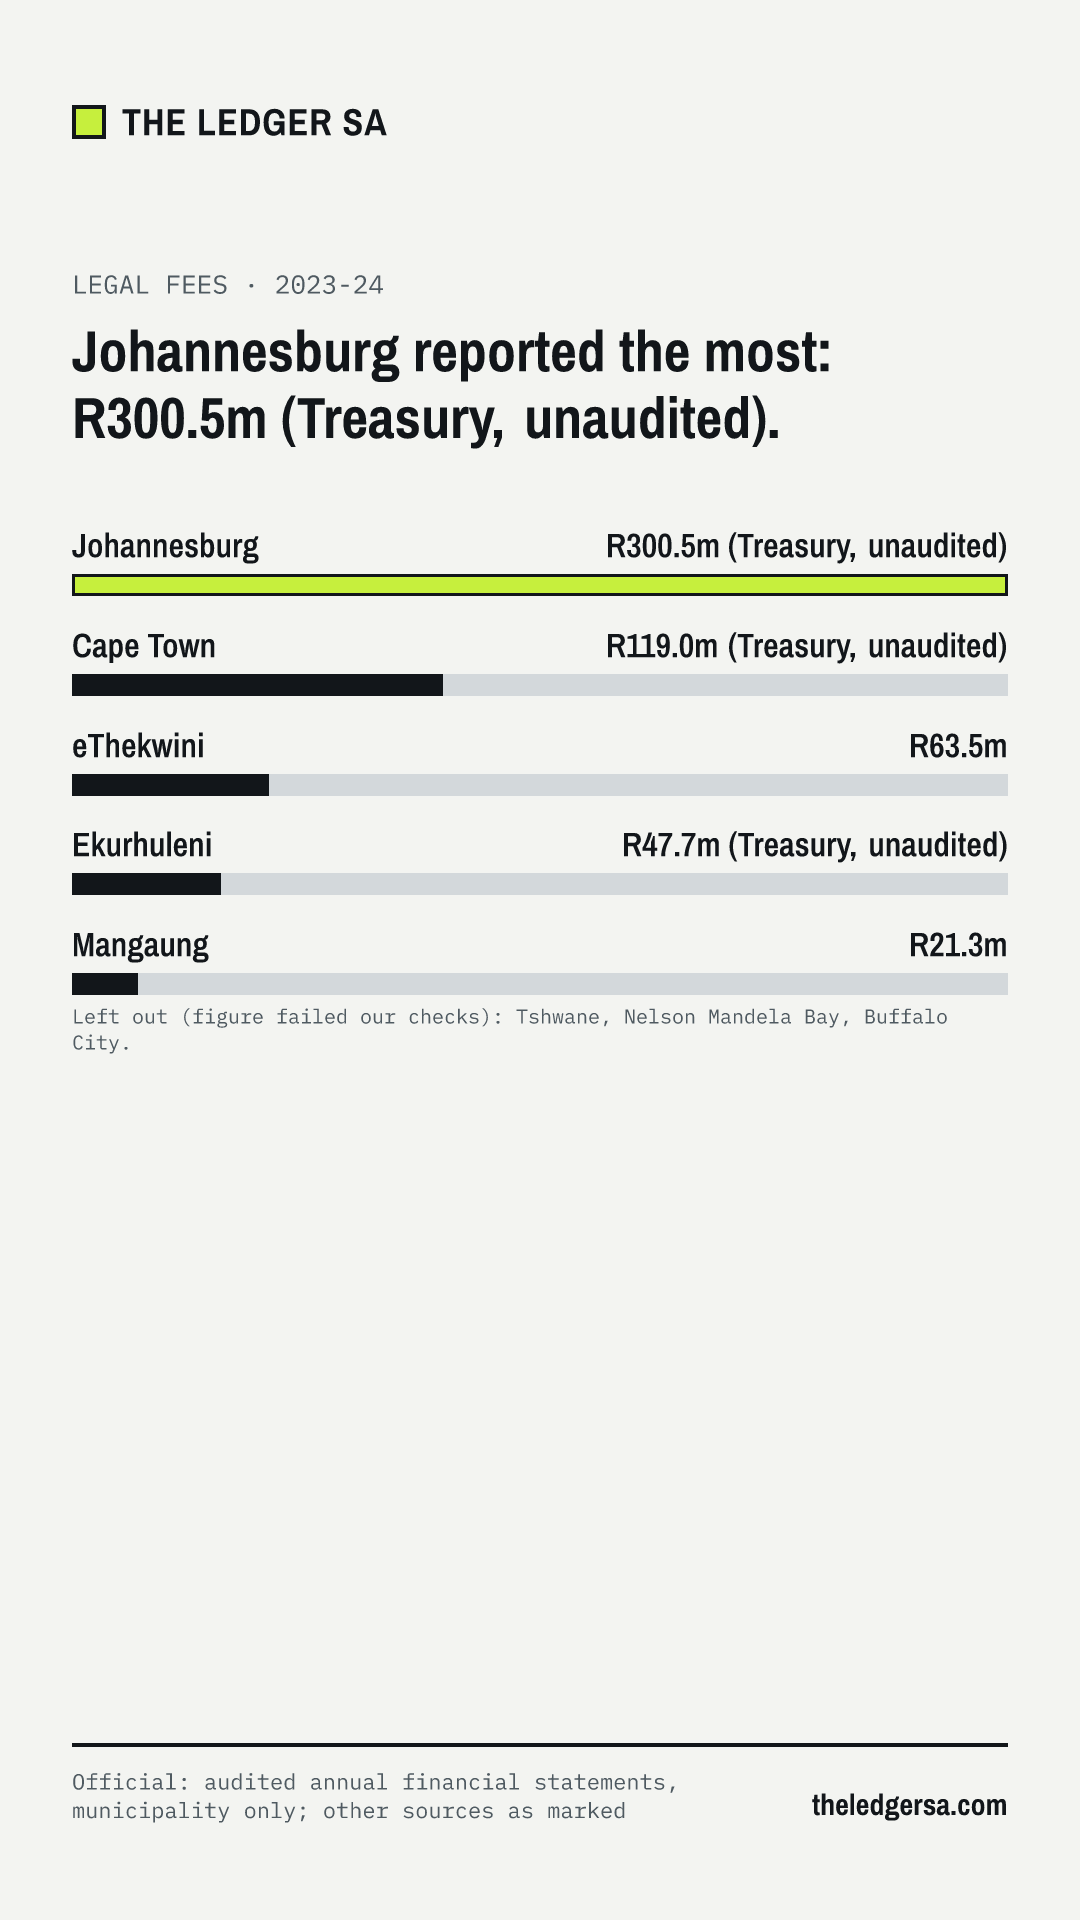
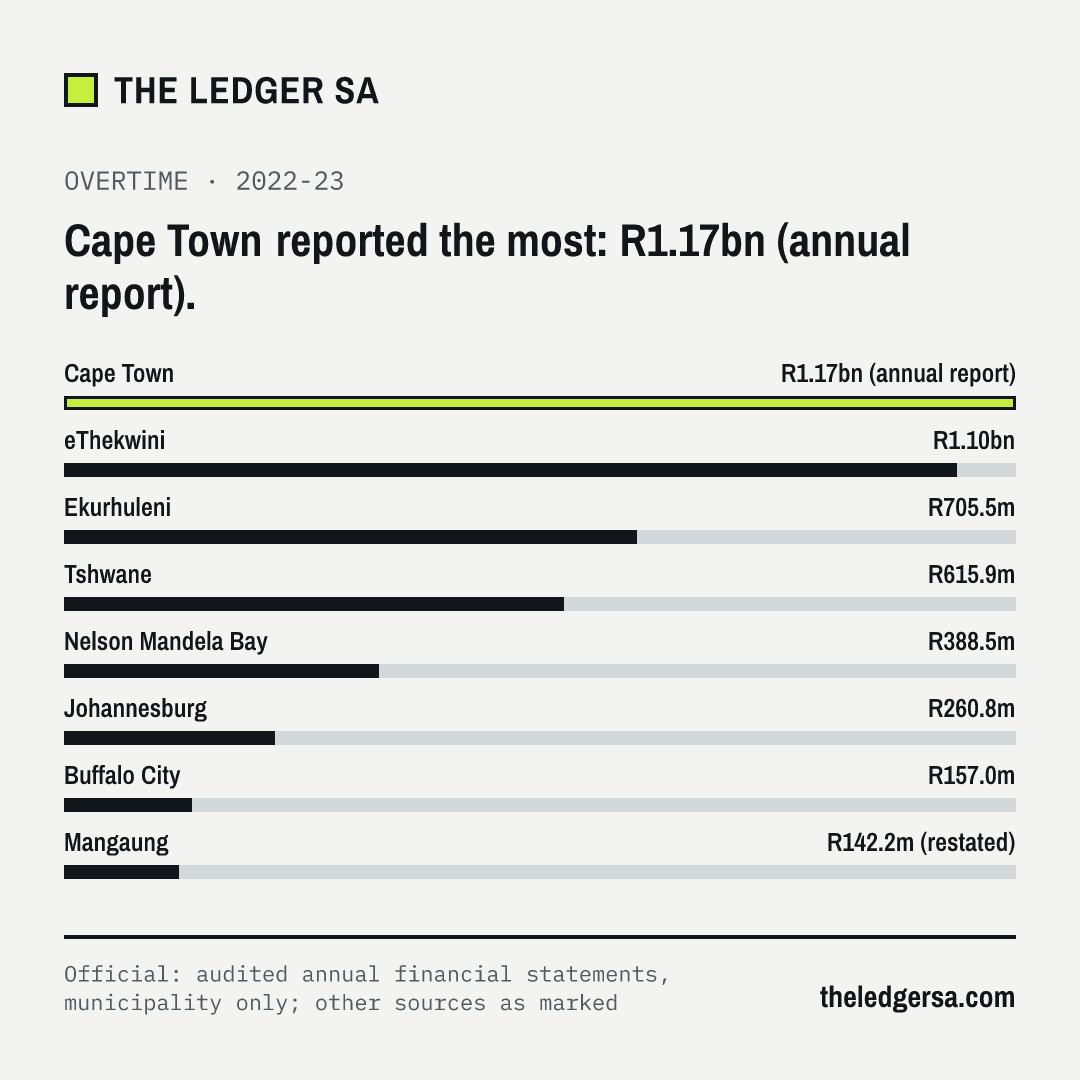
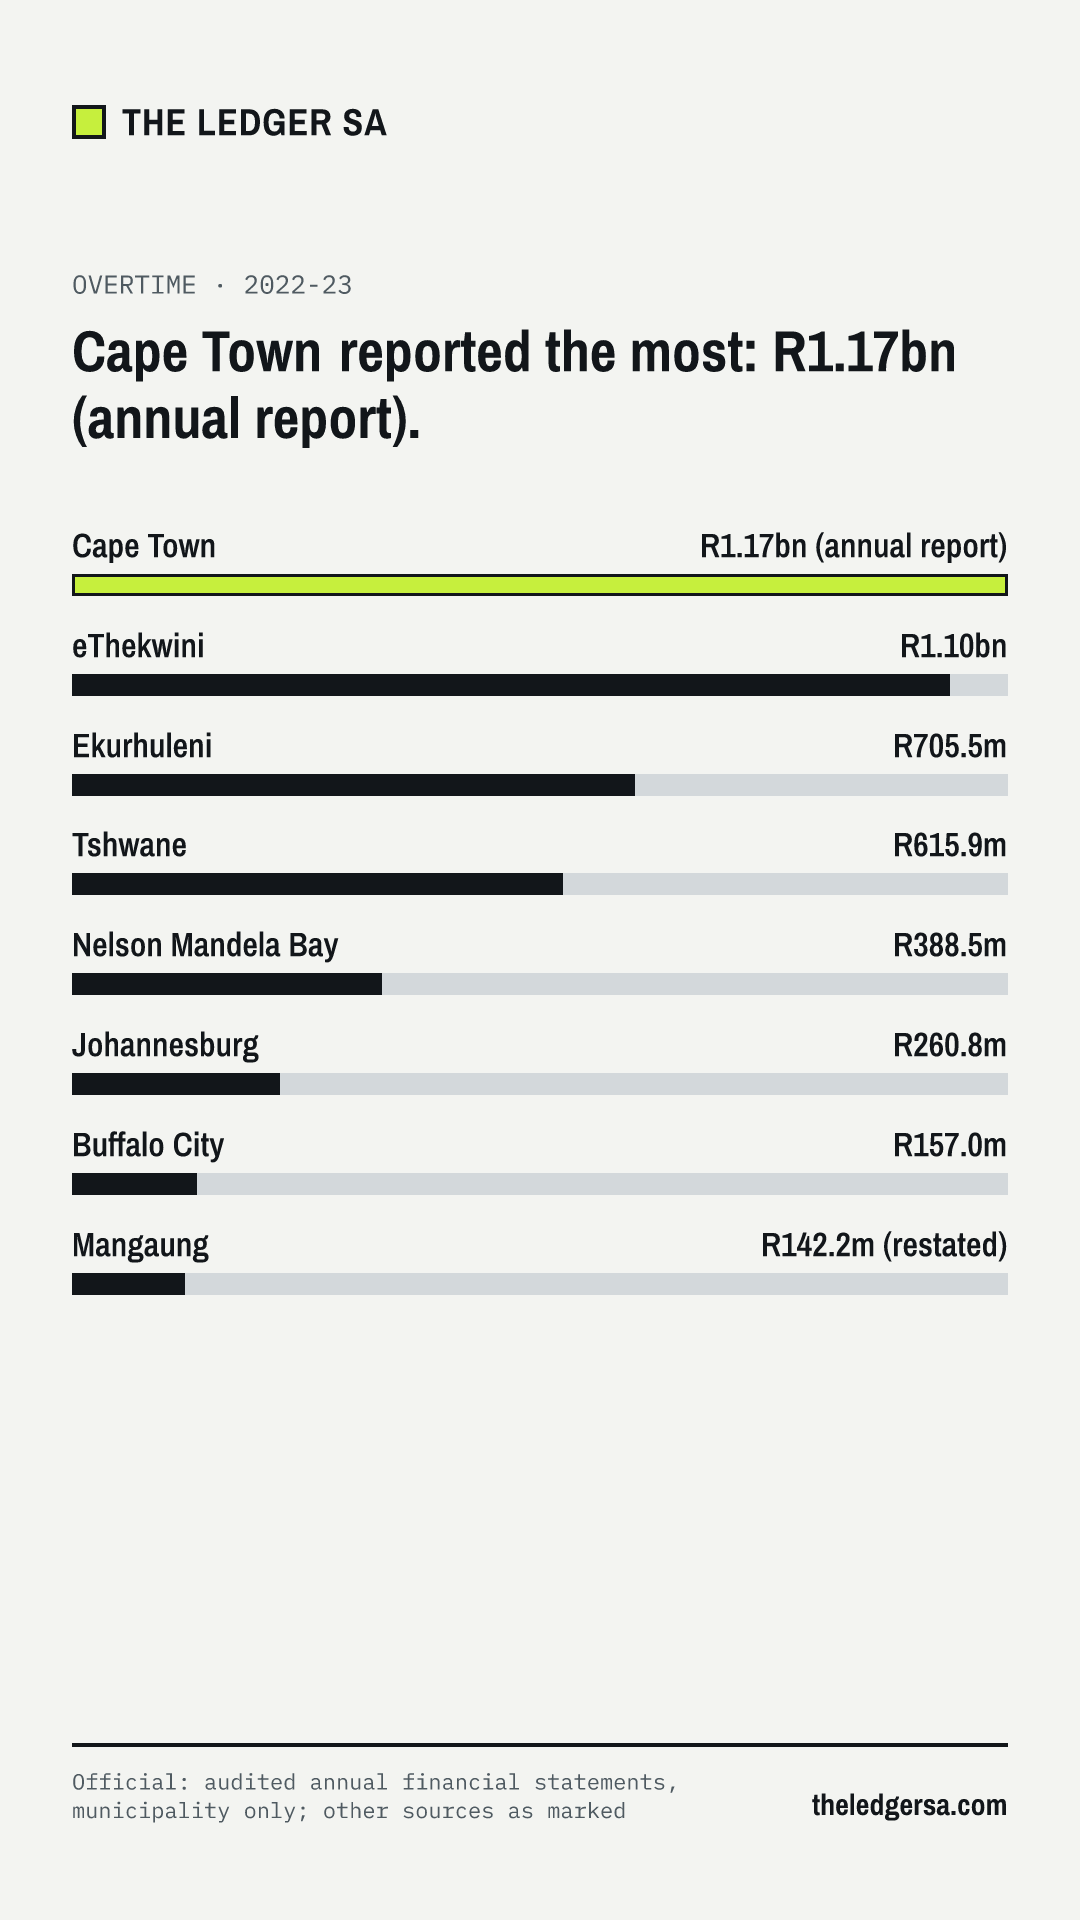
An asterisk marks a figure our automated checks found inconsistent with another official figure. It is shown as reported, explained in a footnote and left out of rankings.
Audit outcomes
Official: Auditor-General · Data as of 2024-25 audits (Auditor-General, tabled 24 Jun 2026) · Last updated
What these words mean
Audit outcome
The Auditor-General’s verdict on a metro’s annual financial statements and how it followed the law.
Financial years run from July to June. Each outcome links to its source: the Auditor-General’s audit report, as published by National Treasury (Municipal Money), for 2020-21 to 2023-24; and the Auditor-General, MFMA 2024-25 audit outcomes (tabled 24 Jun 2026) for 2024-25. Johannesburg’s outcome is for the city and its entities together (consolidated), as the Auditor-General reports it.
Johannesburg: For 2024-25 the Auditor-General lists the city’s own (separate) financial statements as “Qualified”; the outcome shown is for the city and its entities together (consolidated).
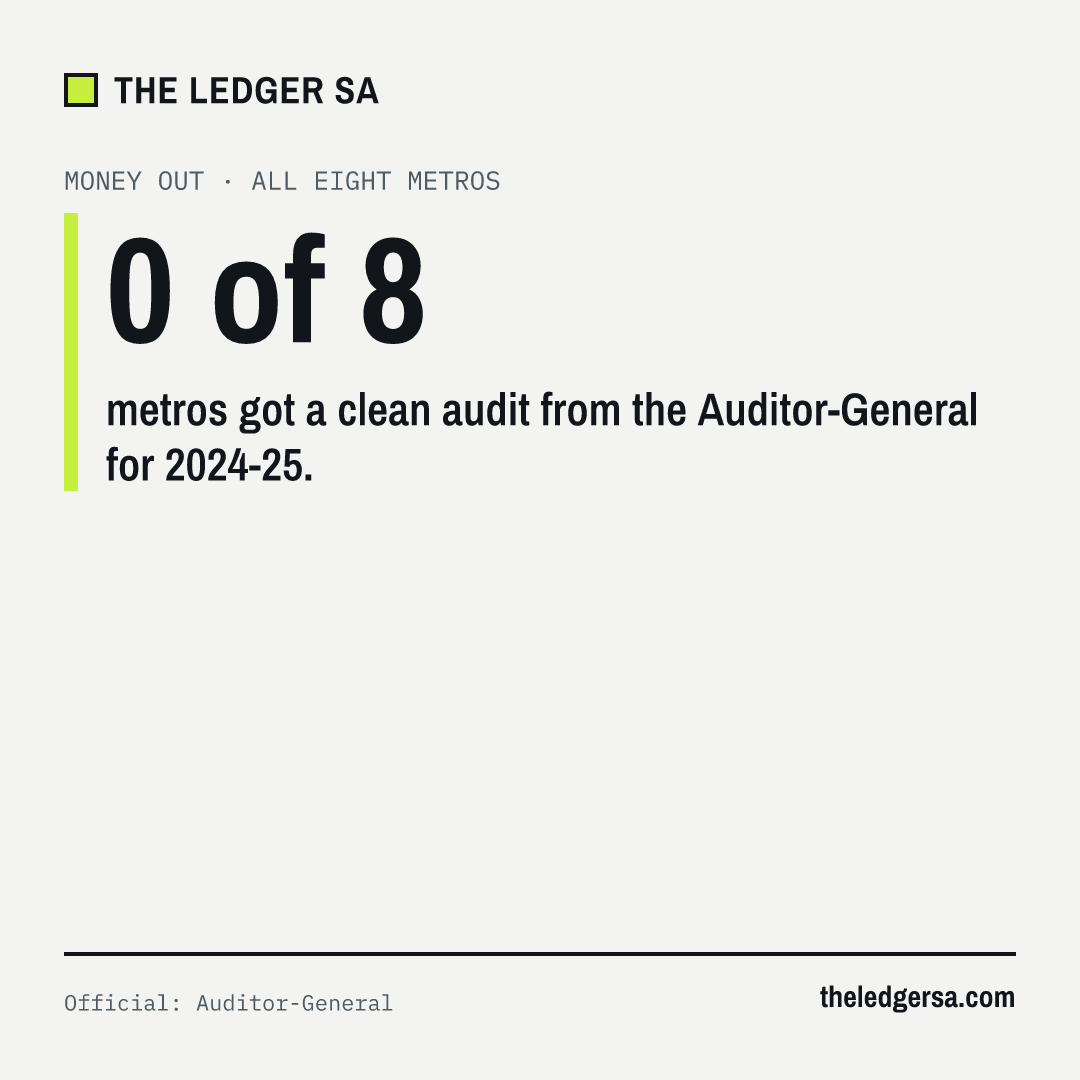
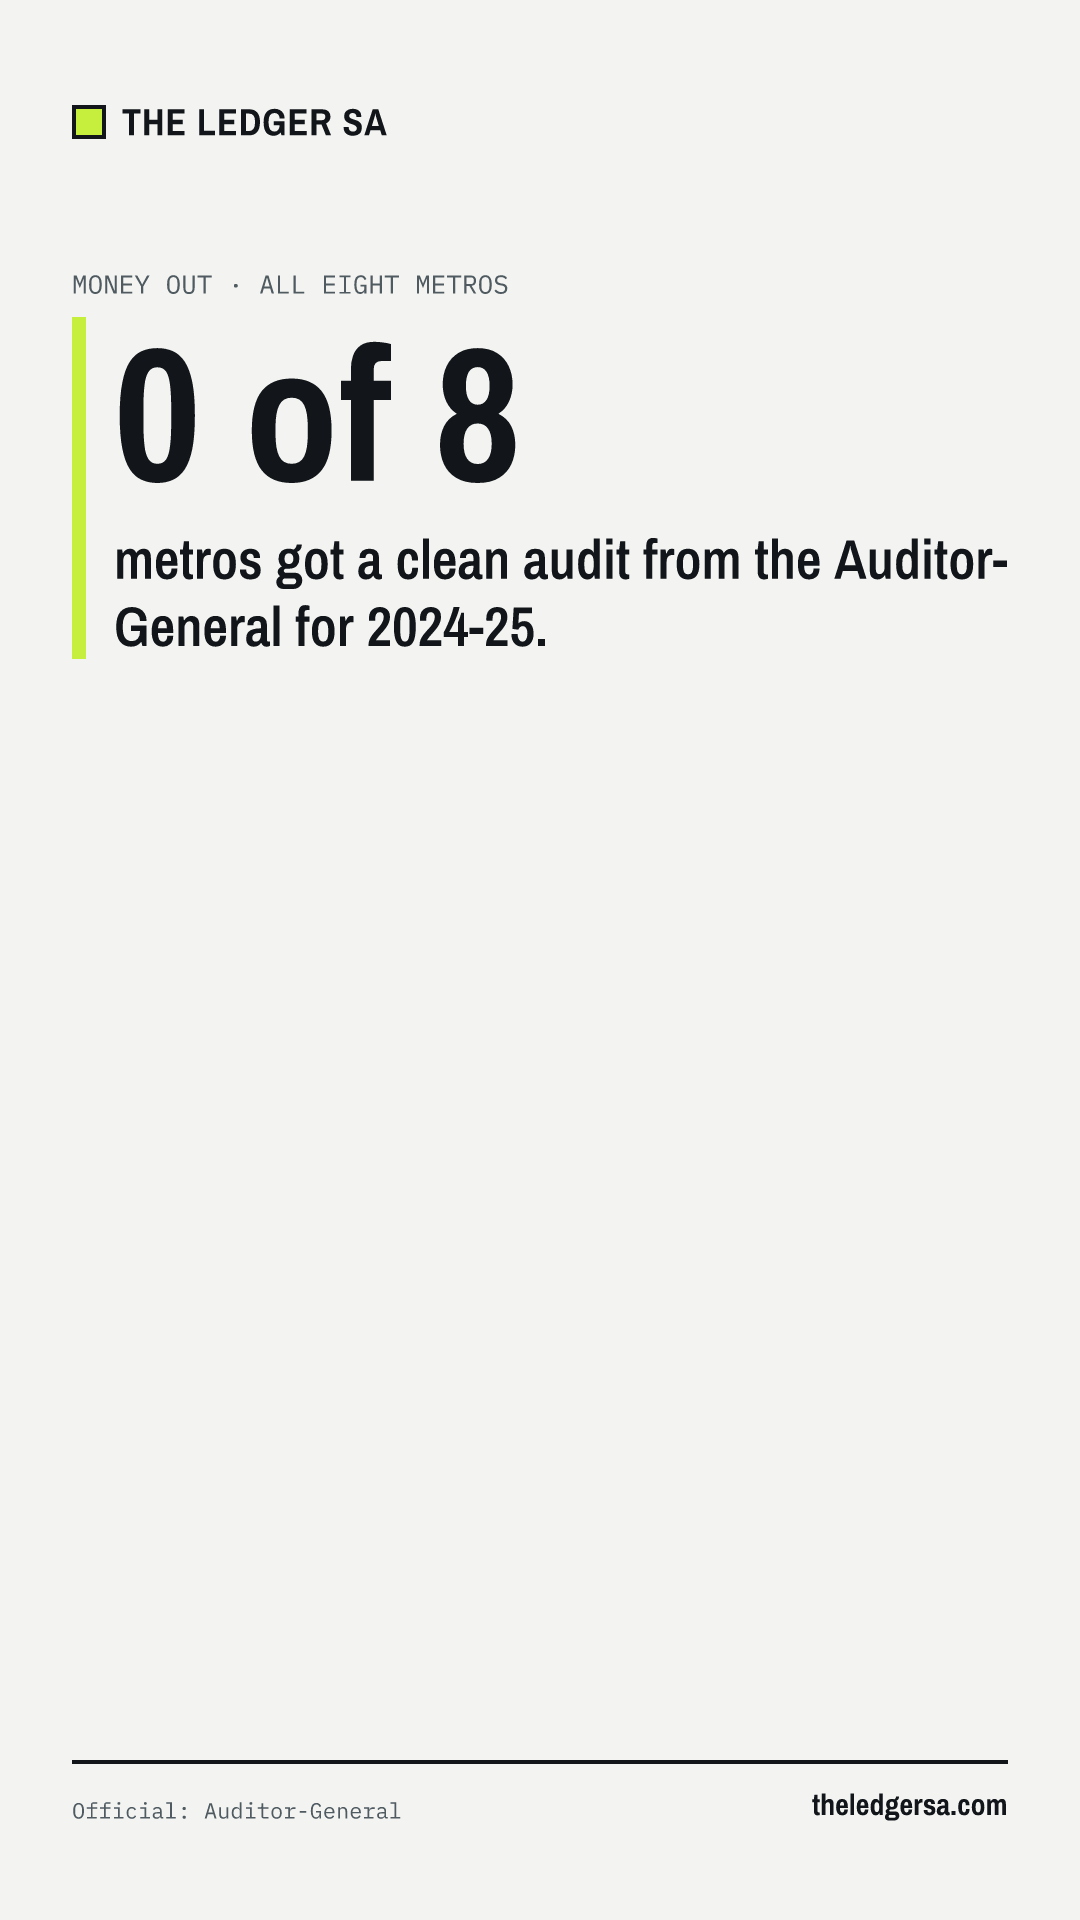
A clean audit means the financial statements are reliable and there were no material findings on performance reporting or compliance with the law. Unqualified with findings: the statements are reliable, but the auditors found problems with performance reporting or compliance. Qualified: parts of the statements could not be relied on. Adverse: the statements were wrong in many respects. Disclaimer: the auditors could not find enough evidence to give an opinion.
Spending the rules did not allow
Official: Auditor-General, National Treasury · Data as of 2024-25 financial year (audited) · Last updated
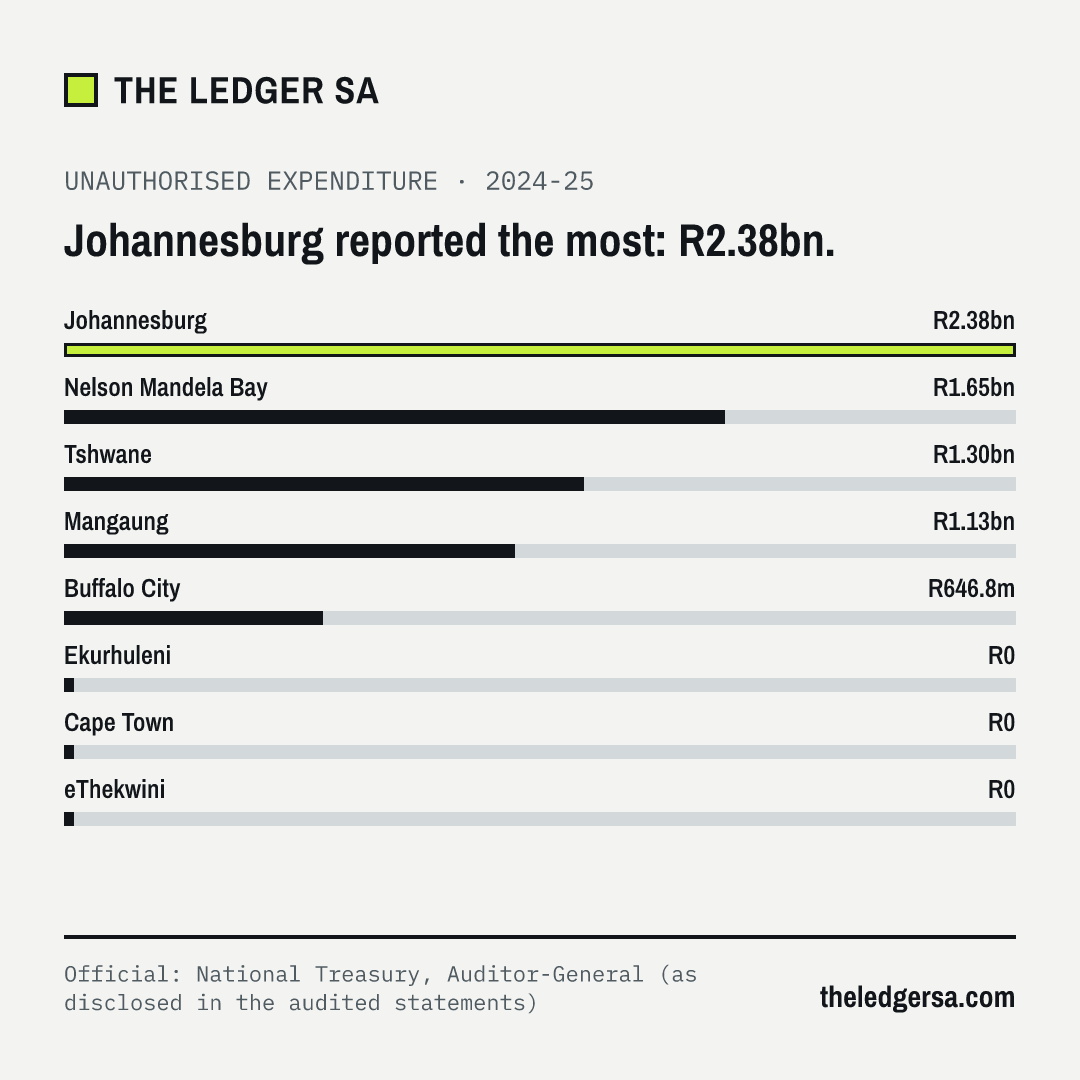
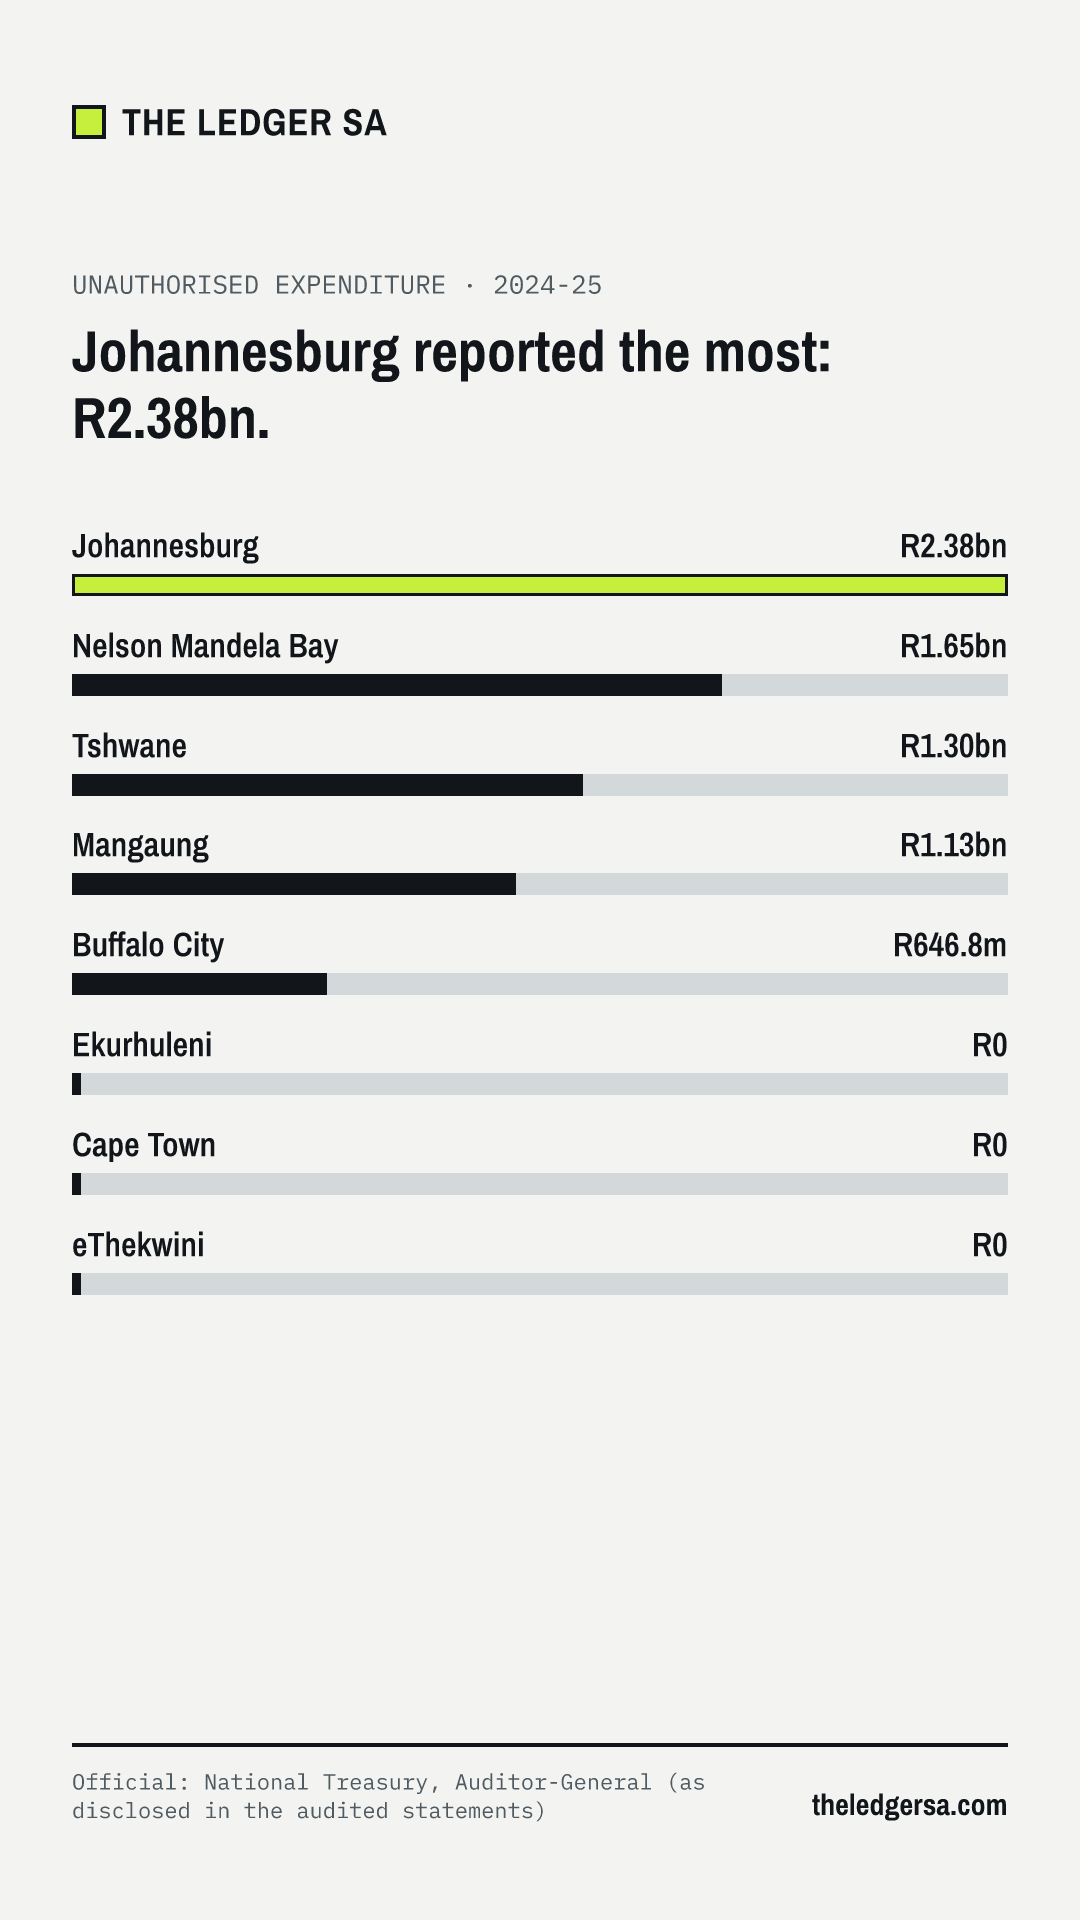
Unauthorised
Spending more than the council approved in the budget, or spending on something the budget did not provide for.
Irregular
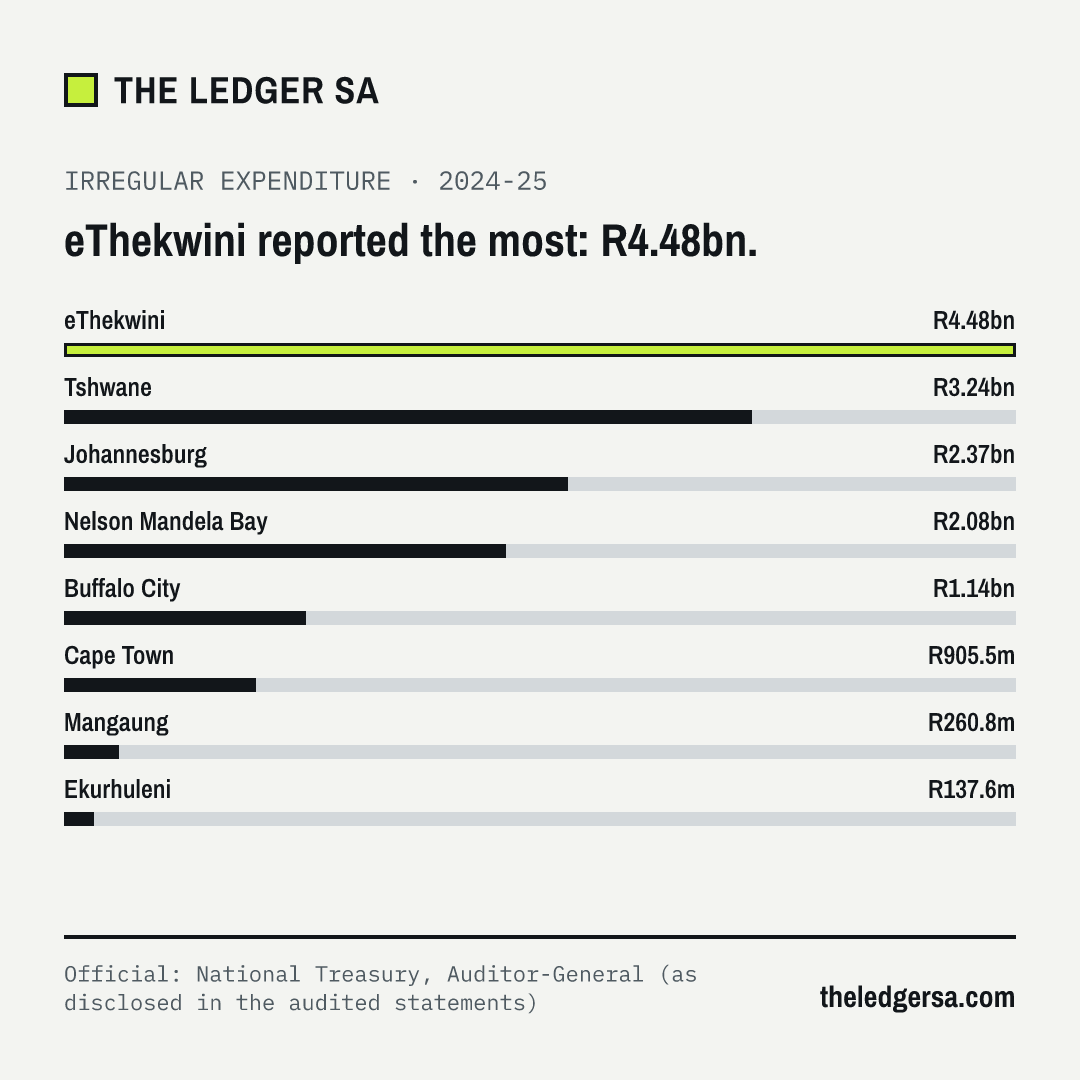
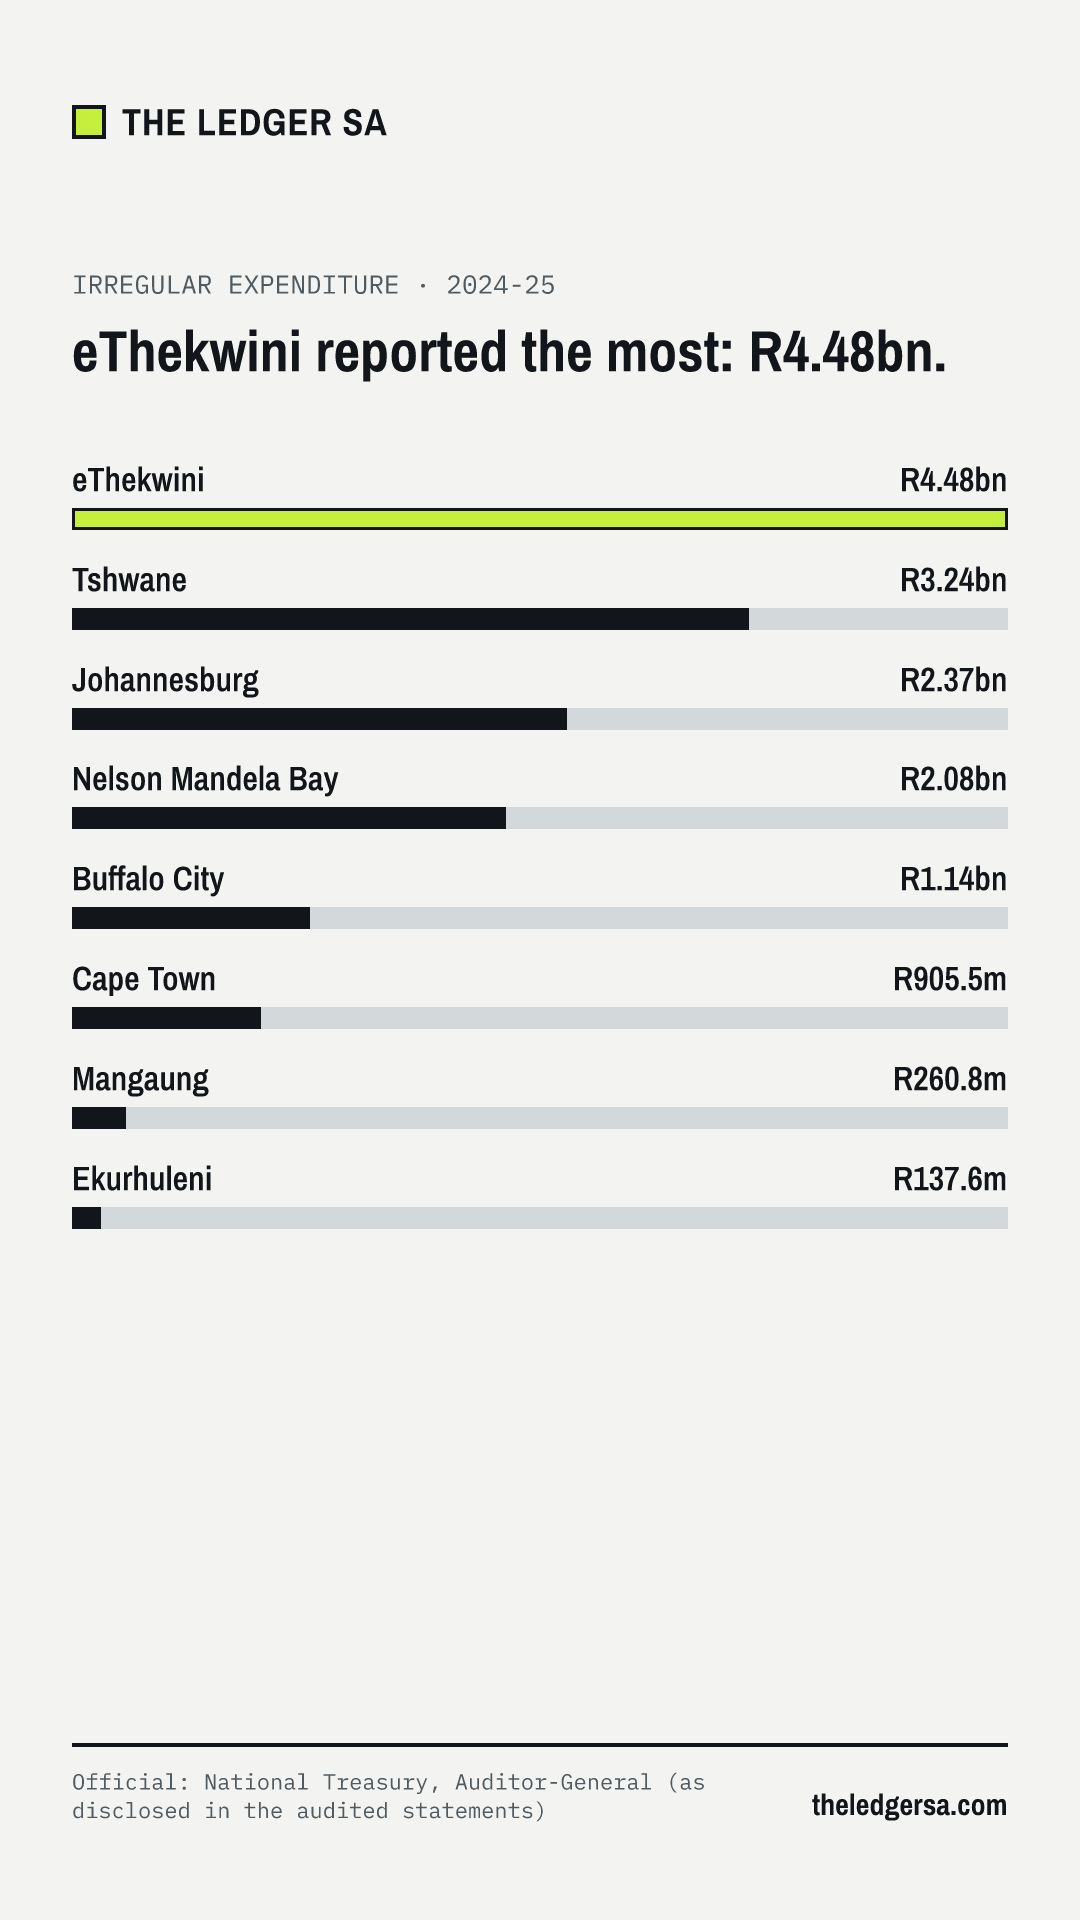
Spending that did not follow the rules, usually the procurement rules for getting quotes or running a tender.
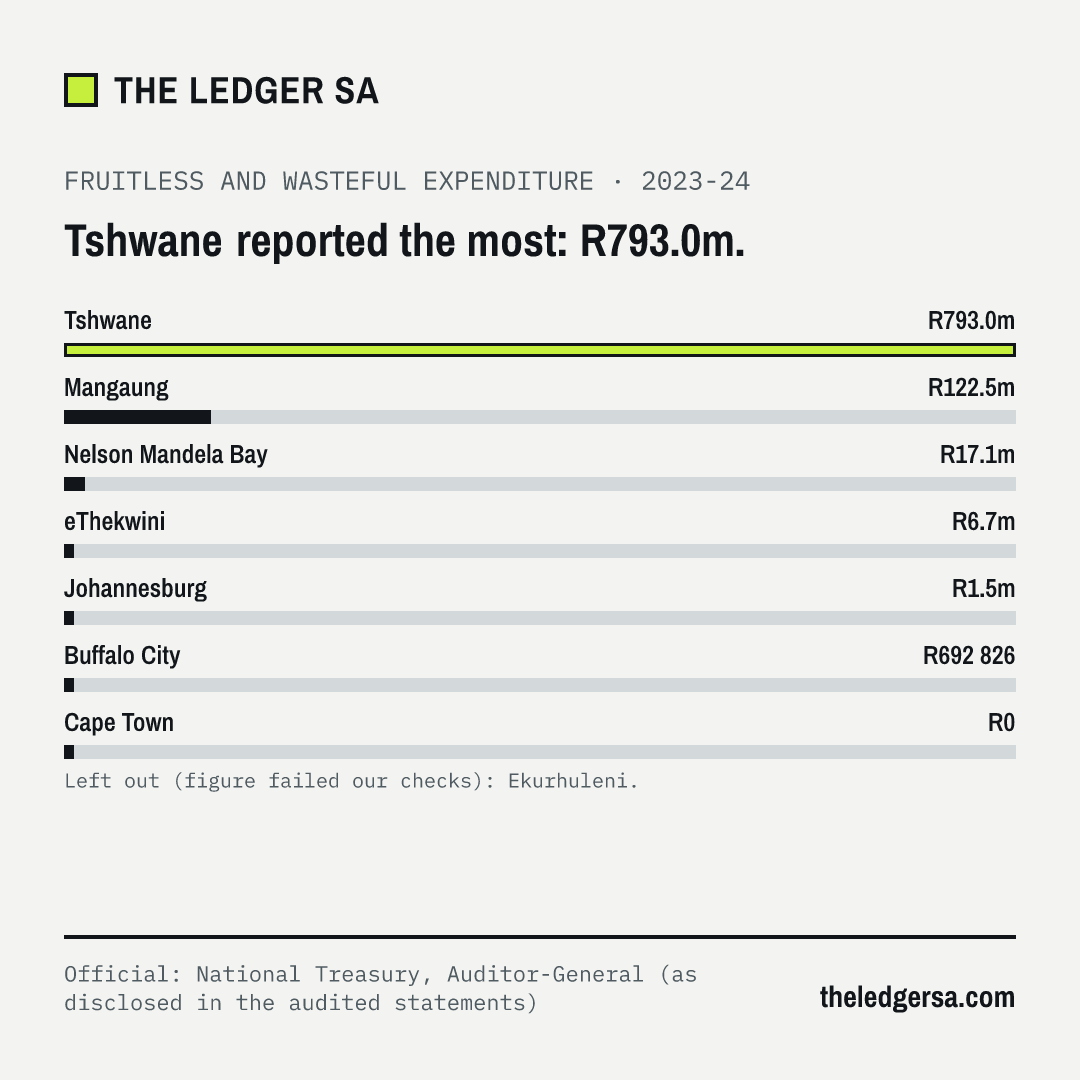
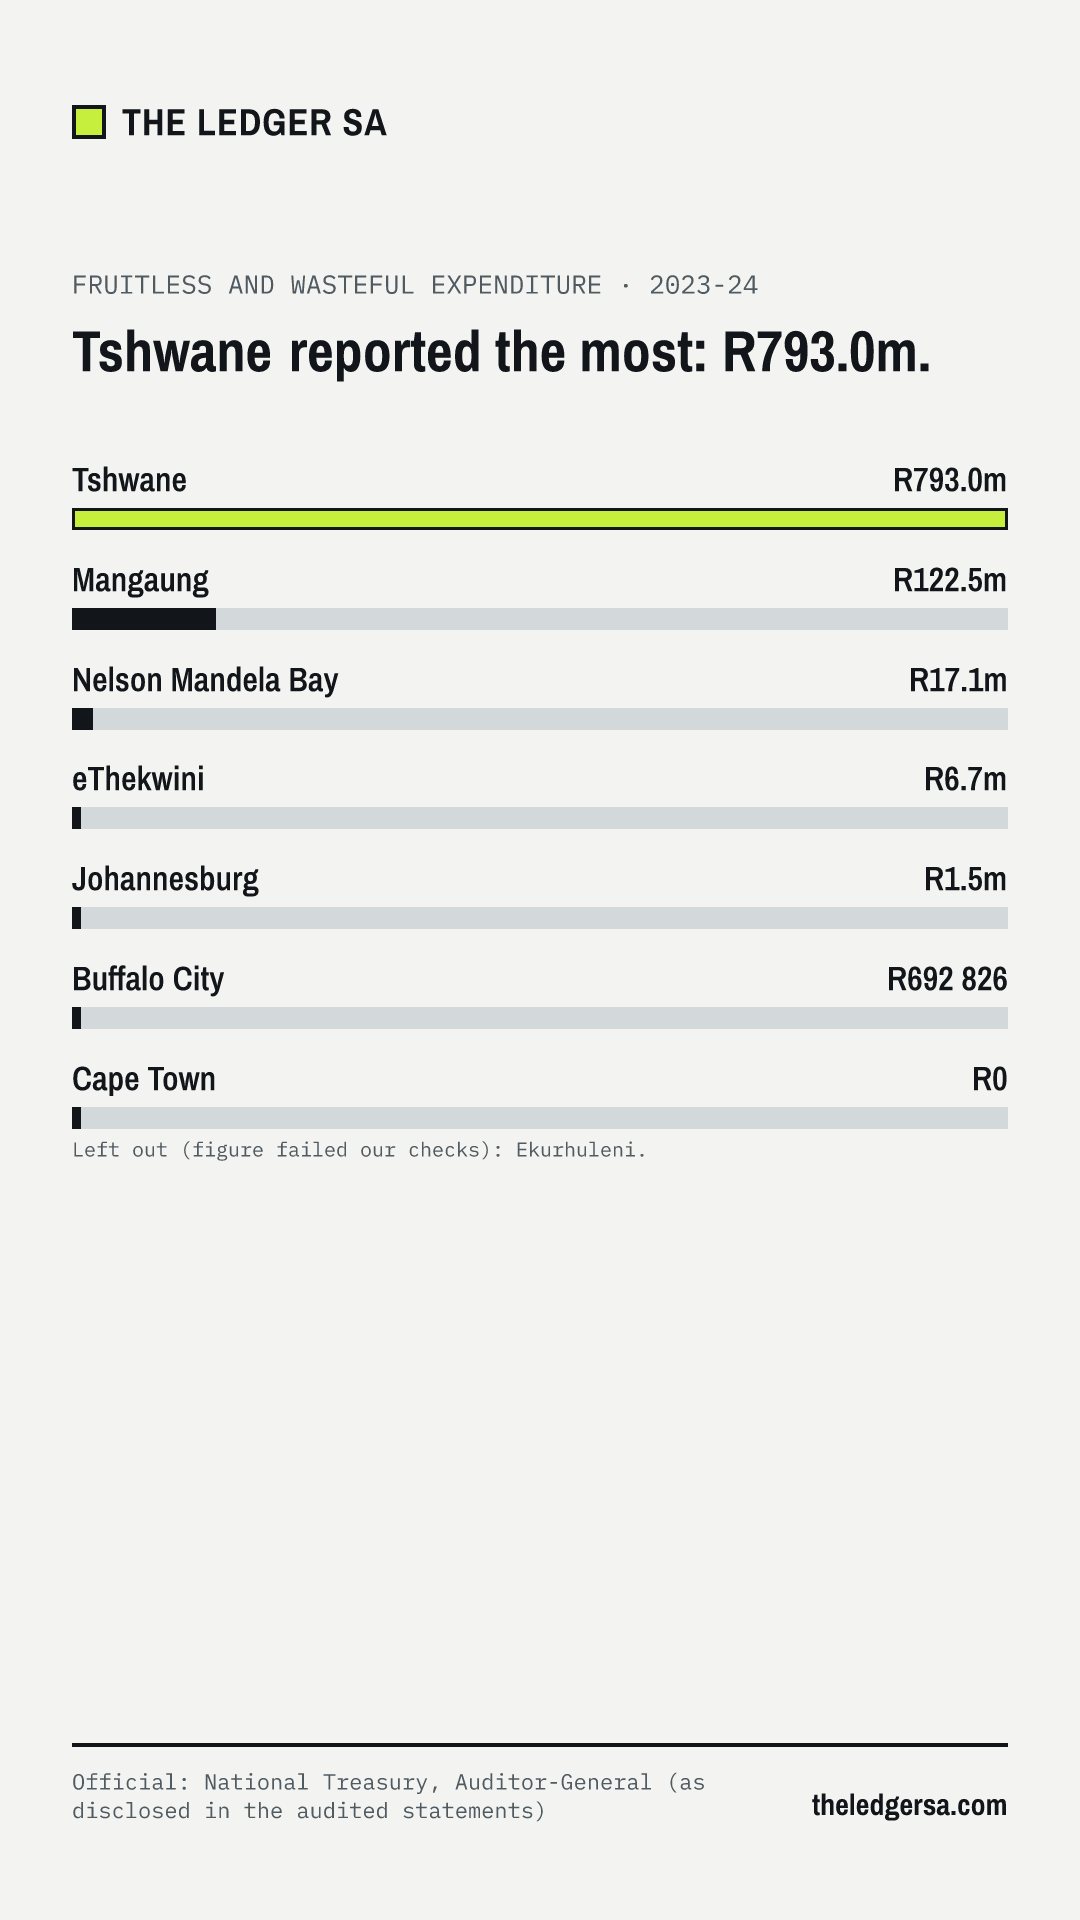
Fruitless and wasteful
Spending that was made in vain and could have been avoided with reasonable care, such as interest paid on a late account.
Irregular does not mean stolen. It means the rules for spending the money were not followed. The goods or services may still have been delivered at a fair price. The council must investigate each case, and may condone it or recover the money.
Source: National Treasury, Municipal Money. Each figure links to its exact query. These amounts are as disclosed in the audited financial statements. 2024-25 figures come from the Auditor-General’s MFMA 2024-25 report, which Treasury’s dataset does not have yet; earlier years are checked against the Auditor-General’s figures.
Source: National Treasury, Municipal Money. Each figure links to its exact query. These amounts are as disclosed in the audited financial statements. 2024-25 figures come from the Auditor-General’s MFMA 2024-25 report, which Treasury’s dataset does not have yet; earlier years are checked against the Auditor-General’s figures.
Source: National Treasury, Municipal Money. Each figure links to its exact query. These amounts are as disclosed in the audited financial statements. 2024-25 figures come from the Auditor-General’s MFMA 2024-25 report, which Treasury’s dataset does not have yet; earlier years are checked against the Auditor-General’s figures.
*1 As reported to National Treasury. This figure is inconsistent with the year before (it is 184.9 times smaller than the 2022-23 figure) and may be a reporting error.
Treasury norm (Circular 71): 0%. The thin lines on the bars mark it.
Source: National Treasury, Municipal Money. Each figure links to its exact query. Operating spending is the sum of the expenditure lines in the same dataset.
*1 As reported to National Treasury. This figure is inconsistent with the year before (it is 10.0 times the 2023-24 figure) and may be a reporting error.
*2 As reported to National Treasury. This figure is inconsistent with the year before (it is 4.4 times smaller than the 2023-24 figure) and may be a reporting error.
What metros spend on
Official: audited annual financial statements · Data as of 2024-25 financial year (audited statements) · Next update expected Jan 2027 (2025-26 annual reports) · Last updated
What these words mean
Unaudited
Reported by the metro but not yet checked by the Auditor-General.
mSCOA returns
The monthly figures every municipality must send National Treasury, using one standard list of accounts.
Restated
A figure the metro corrected in the following year’s statements.
Selected costs from each metro’s audited financial statements. The per-day figure is the year’s total divided by the days in that financial year. Per resident uses Stats SA’s mid-year population estimates.
Source: each metro’s audited annual financial statements (municipality only, not its entities). Where the statements do not show a line separately: the next year’s statements (restated), the metro’s annual report, or its monthly mSCOA returns to National Treasury for 2023-24 and 2024-25, each marked as such. Each figure links to its source.
*1 As reported to National Treasury and the Auditor-General in the audited annual financial statements. This figure is inconsistent with the figure the metro reported to Treasury for the same year (R4,565,434, unaudited) (it differs from that figure by 256%) and may be a reporting error.
*2 As reported to National Treasury and the Auditor-General in the audited annual financial statements. This figure is inconsistent with the figure the metro reported to Treasury for the same year (R2,483,880, unaudited) (it differs from that figure by 39%) and may be a reporting error.
*3 As reported to National Treasury and the Auditor-General in the audited annual financial statements. This figure is inconsistent with the figure the metro reported to Treasury for the same year (R3,376,763, unaudited) (it differs from that figure by 49%) and may be a reporting error.
Source: each metro’s audited annual financial statements (municipality only, not its entities). Where the statements do not show a line separately: the next year’s statements (restated), the metro’s annual report, or its monthly mSCOA returns to National Treasury for 2023-24 and 2024-25, each marked as such. Each figure links to its source.
Source: each metro’s audited annual financial statements (municipality only, not its entities). Where the statements do not show a line separately: the next year’s statements (restated), the metro’s annual report, or its monthly mSCOA returns to National Treasury for 2023-24 and 2024-25, each marked as such. Each figure links to its source.
*1 As reported to National Treasury and the Auditor-General in the audited annual financial statements. This figure is inconsistent with the year before (it is 3.5 times smaller than the 2022-23 figure) and may be a reporting error.
*2 As reported to National Treasury and the Auditor-General in the audited annual financial statements. This figure is inconsistent with the figure the metro reported to Treasury for the same year (R61,060,205, unaudited) (it differs from that figure by 90%) and may be a reporting error.
*3 As reported to National Treasury and the Auditor-General in the audited annual financial statements. This figure is inconsistent with the figure the metro reported to Treasury for the same year (R45,663,344, unaudited) (it differs from that figure by 27%) and may be a reporting error.
MangaungR142.2mR389 480 a day · R167.44 per resident · as restated in 2023-24 statements
Source: each metro’s audited annual financial statements (municipality only, not its entities). Where the statements do not show a line separately: the next year’s statements (restated), the metro’s annual report, or its monthly mSCOA returns to National Treasury for 2023-24 and 2024-25, each marked as such. Each figure links to its source.
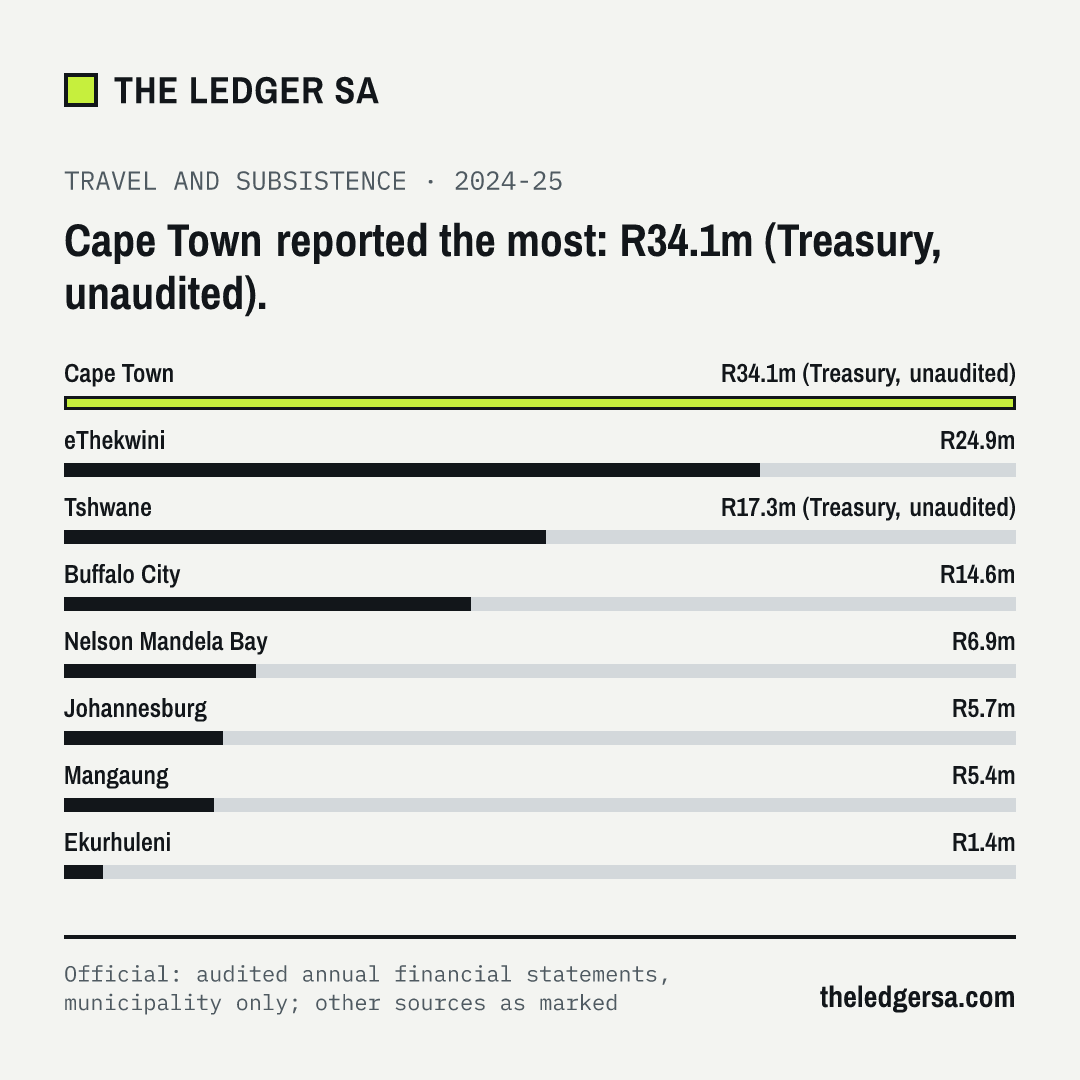
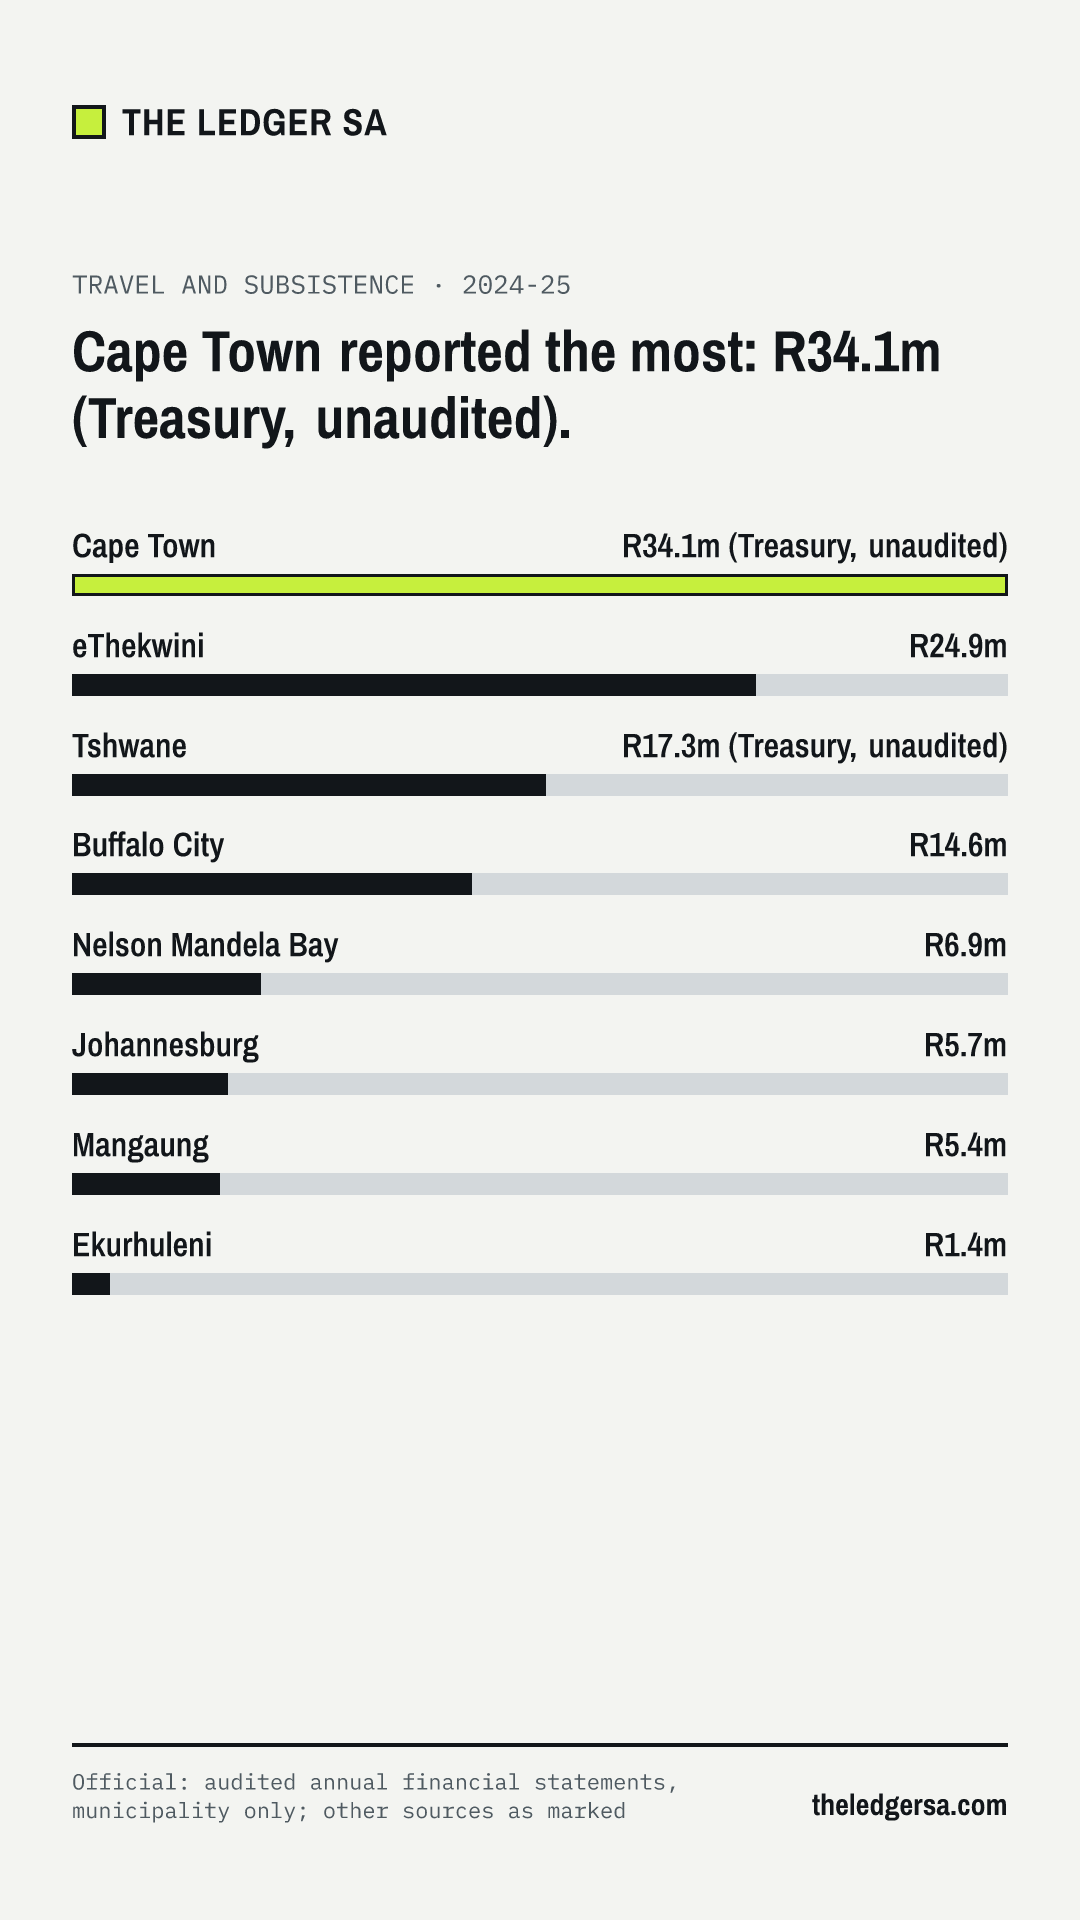
Cape TownR34.1mR93 431 a day · R6.81 per resident · As reported to Treasury (unaudited); mSCOA travel and subsistence, including staff own-transport claims
TshwaneR17.3mR47 273 a day · R4.30 per resident · As reported to Treasury (unaudited); mSCOA travel and subsistence, including staff own-transport claims
Source: each metro’s audited annual financial statements (municipality only, not its entities). Where the statements do not show a line separately: the next year’s statements (restated), the metro’s annual report, or its monthly mSCOA returns to National Treasury for 2023-24 and 2024-25, each marked as such. Each figure links to its source.
Source: each metro’s audited annual financial statements (municipality only, not its entities). Where the statements do not show a line separately: the next year’s statements (restated), the metro’s annual report, or its monthly mSCOA returns to National Treasury for 2023-24 and 2024-25, each marked as such. Each figure links to its source.
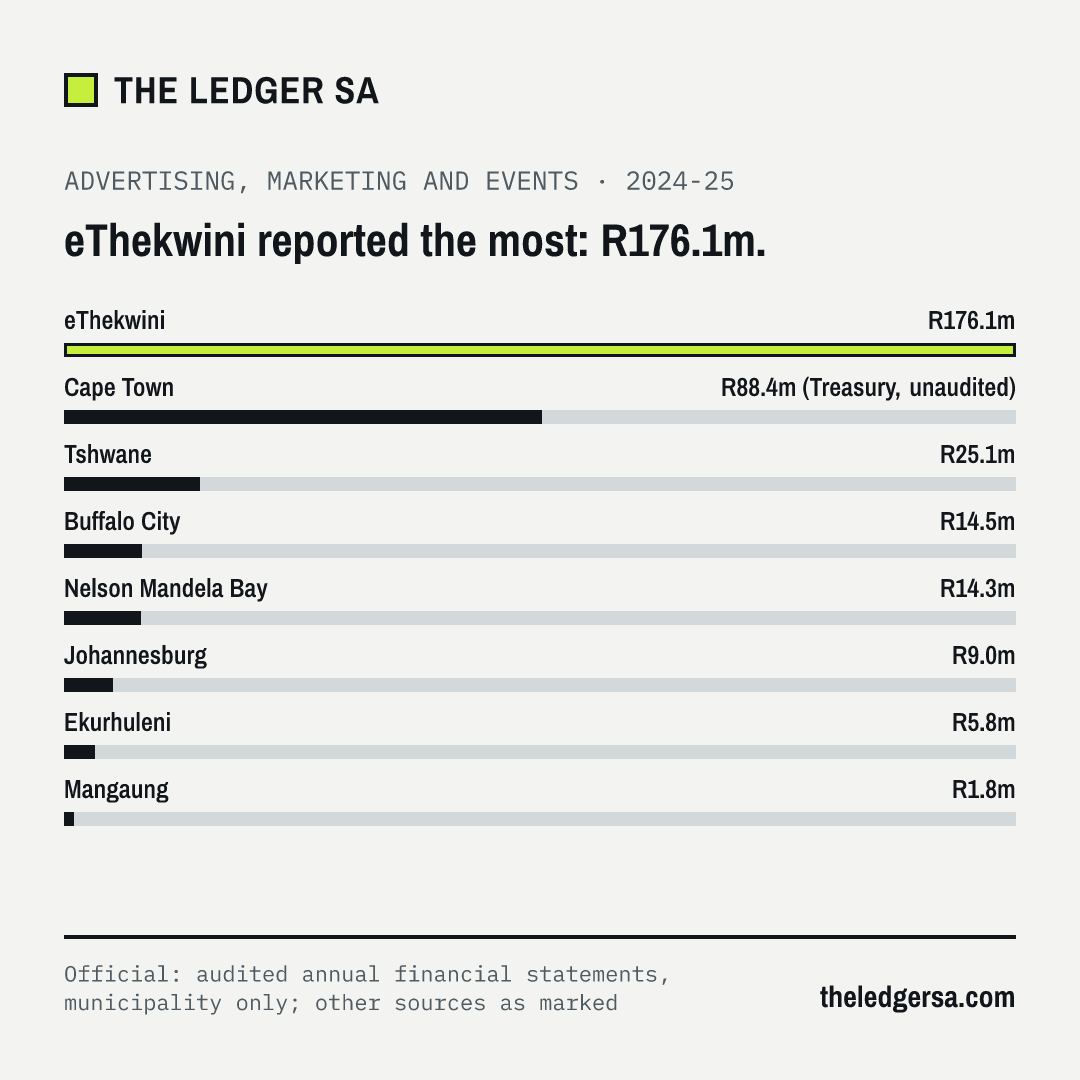
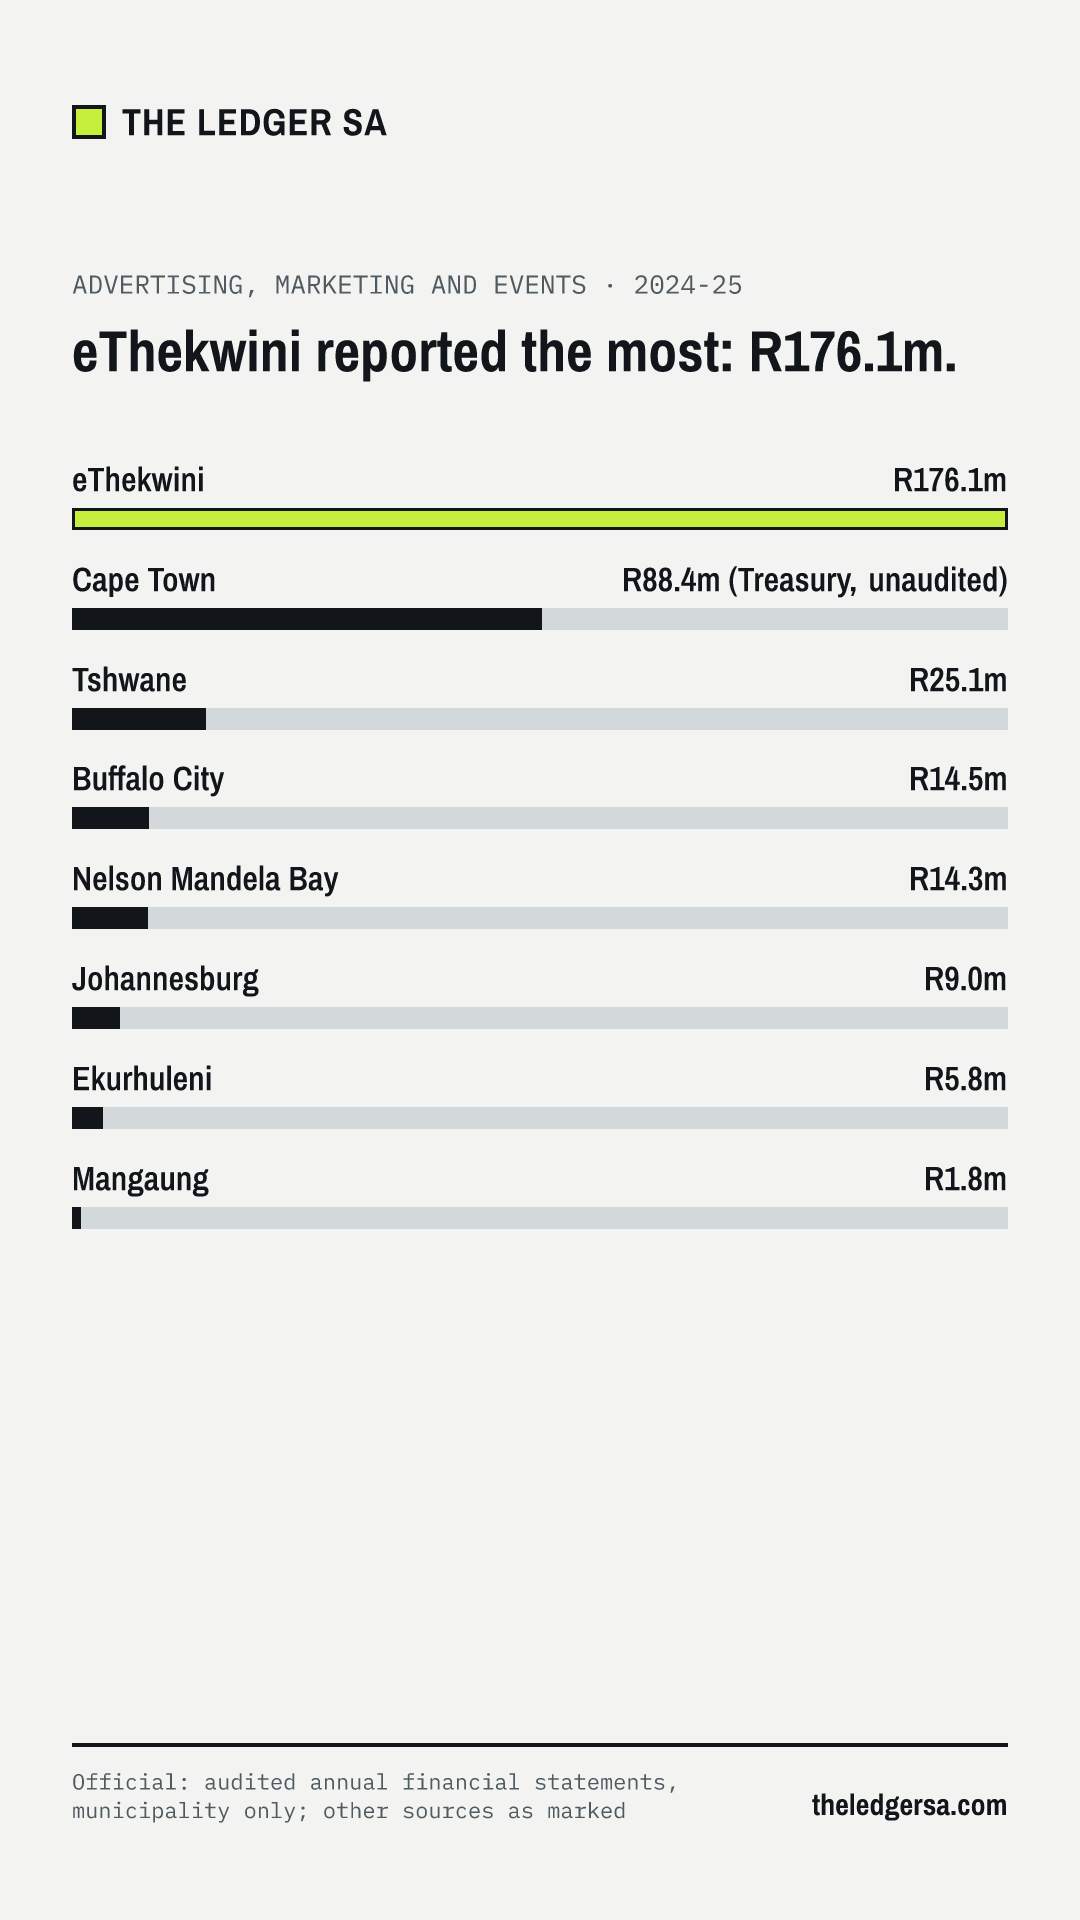
Cape TownR88.4mR242 299 a day · R17.67 per resident · As reported to Treasury (unaudited); mSCOA advertising, publicity and marketing, including recruitment and tender notices and newsletters
Source: each metro’s audited annual financial statements (municipality only, not its entities). Where the statements do not show a line separately: the next year’s statements (restated), the metro’s annual report, or its monthly mSCOA returns to National Treasury for 2023-24 and 2024-25, each marked as such. Each figure links to its source.
Source: each metro’s audited annual financial statements (municipality only, not its entities). Where the statements do not show a line separately: the next year’s statements (restated), the metro’s annual report, or its monthly mSCOA returns to National Treasury for 2023-24 and 2024-25, each marked as such. Each figure links to its source.
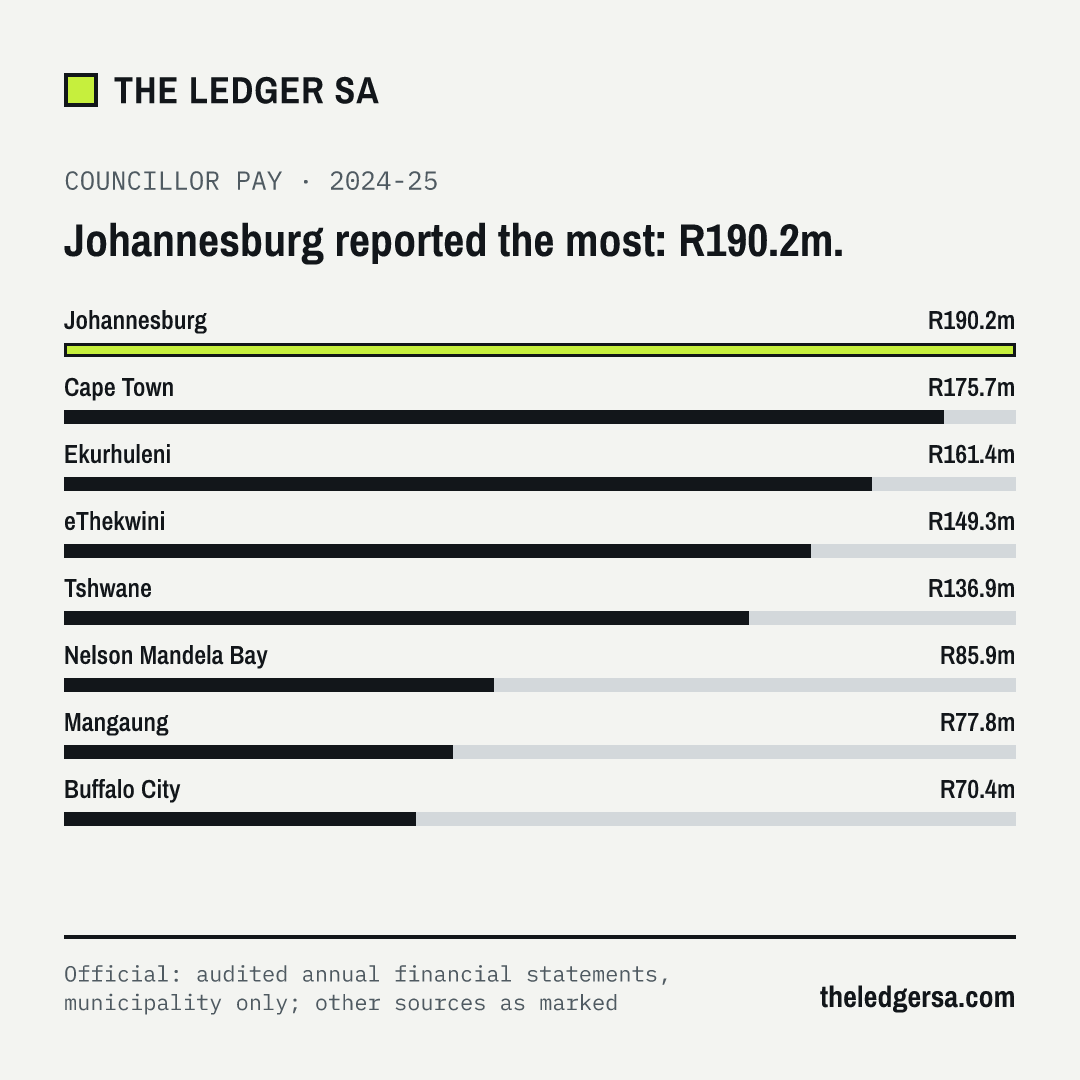
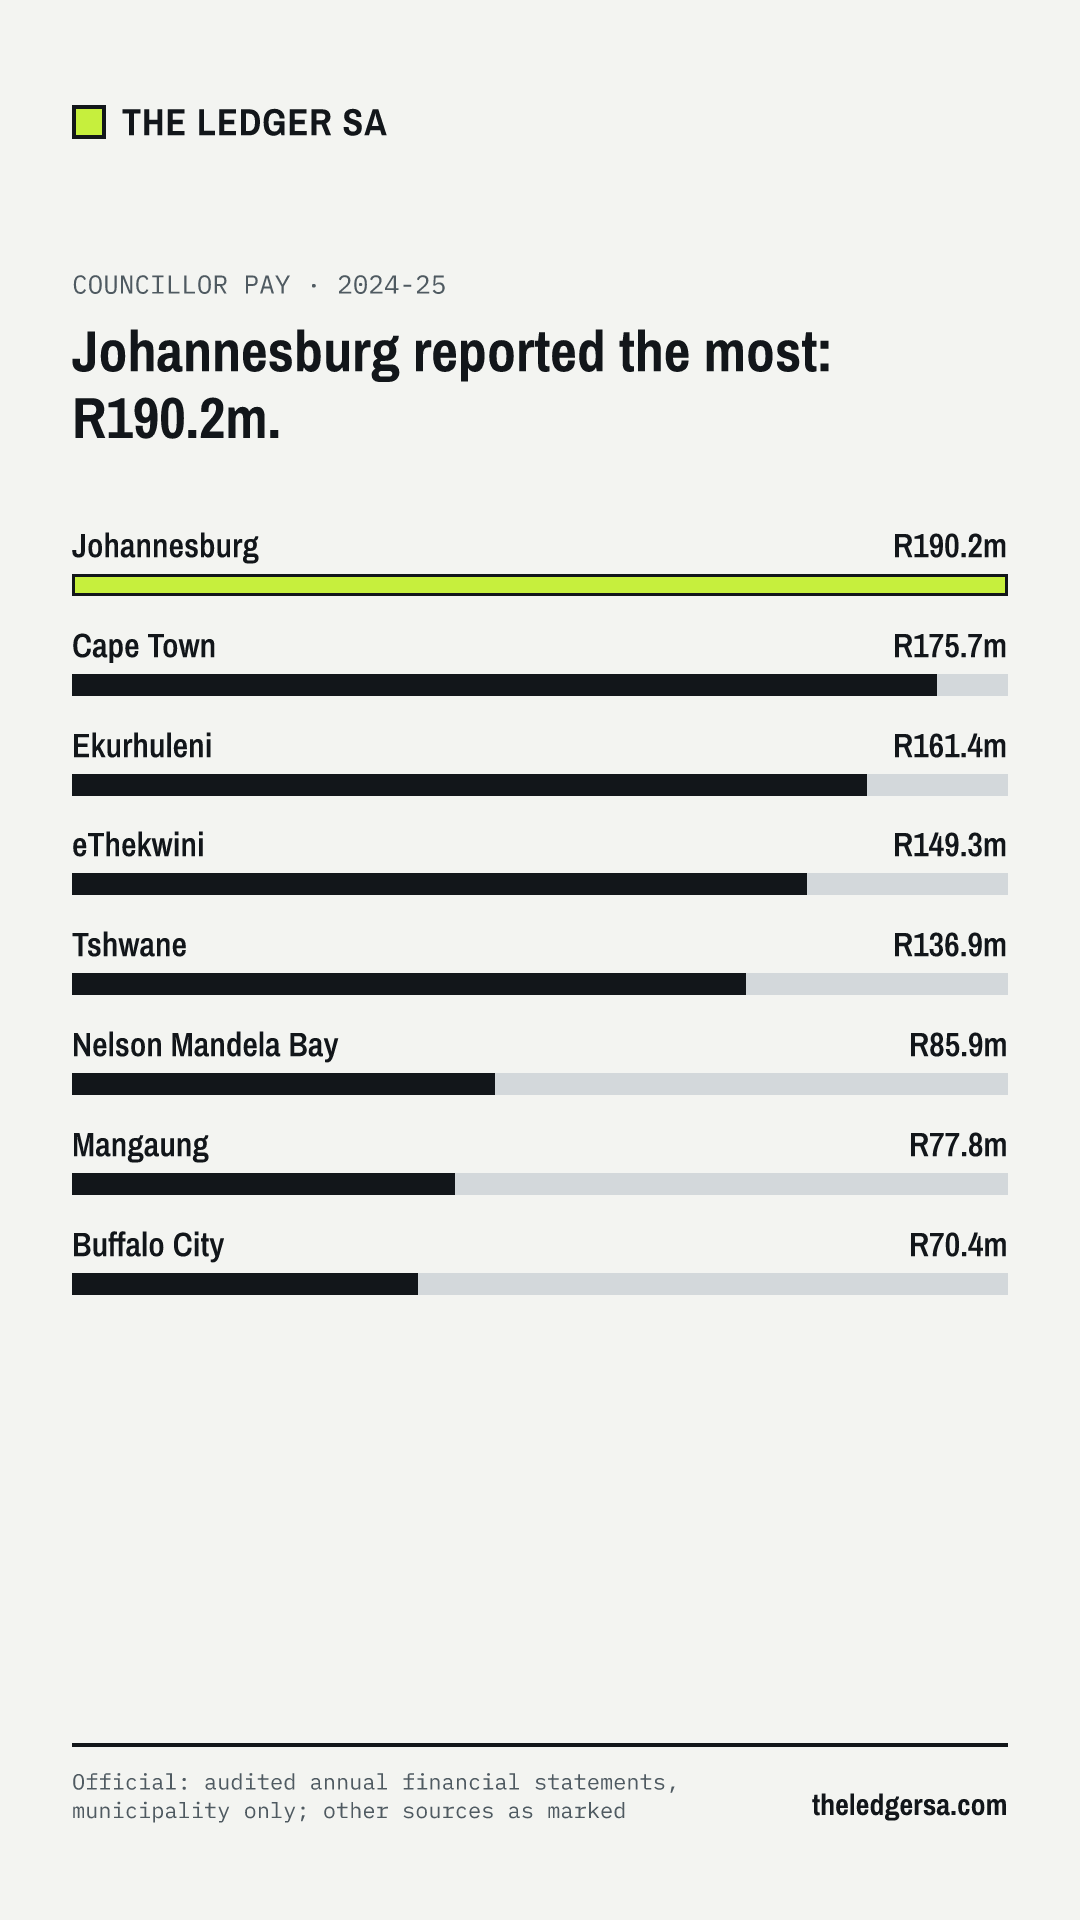
Source: each metro’s audited annual financial statements (municipality only, not its entities). Where the statements do not show a line separately: the next year’s statements (restated), the metro’s annual report, or its monthly mSCOA returns to National Treasury for 2023-24 and 2024-25, each marked as such. Each figure links to its source. Councillor pay is also checked against Treasury’s dataset.
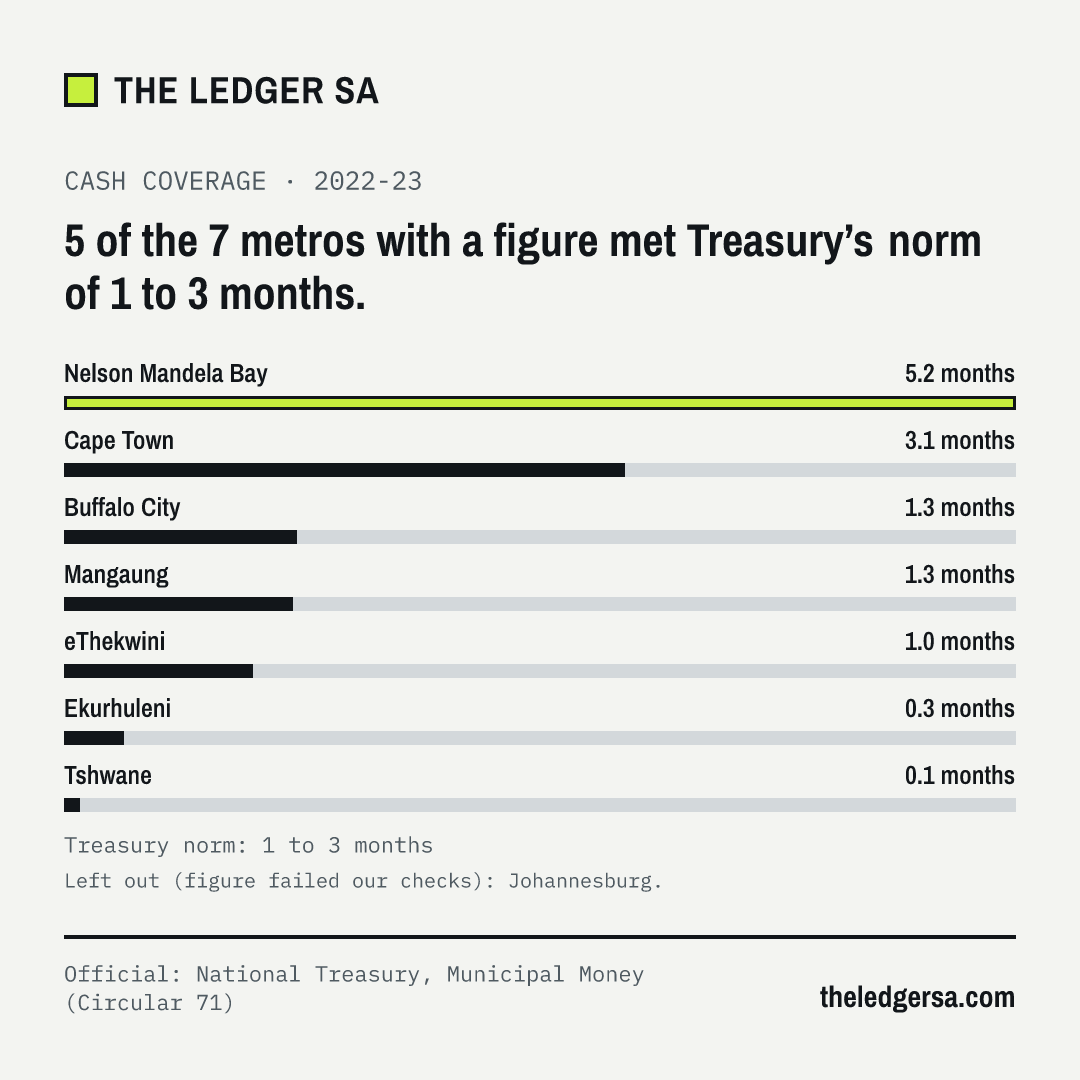
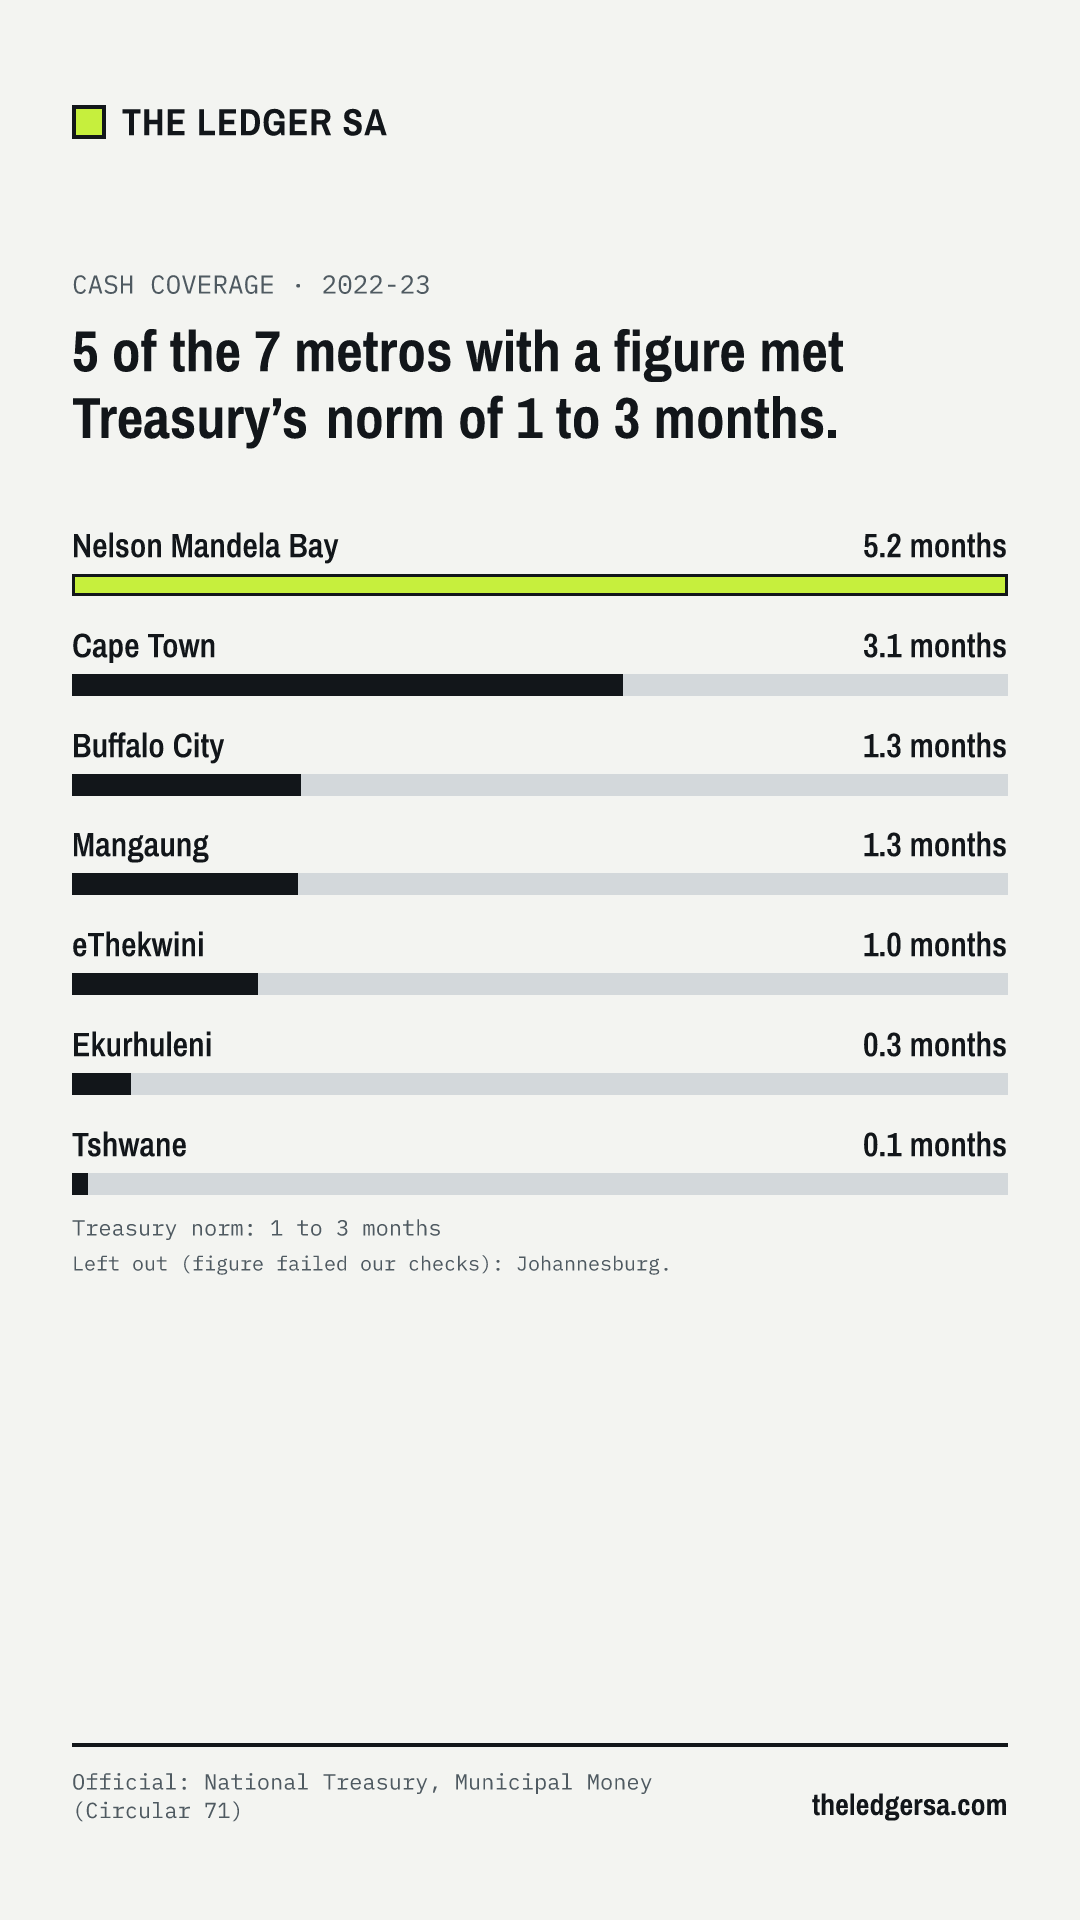
Treasury norm (Circular 71): 1 to 3 months. The thin lines on the bars mark it.
Source: National Treasury, Municipal Money. Each figure links to its exact query. Calculated with the Circular 71 formula (see How we work).
*1 As reported to National Treasury. This figure is inconsistent with the year before (cash and cash equivalents is reported as exactly the same amount for 2021-22 and 2022-23) and may be a reporting error.
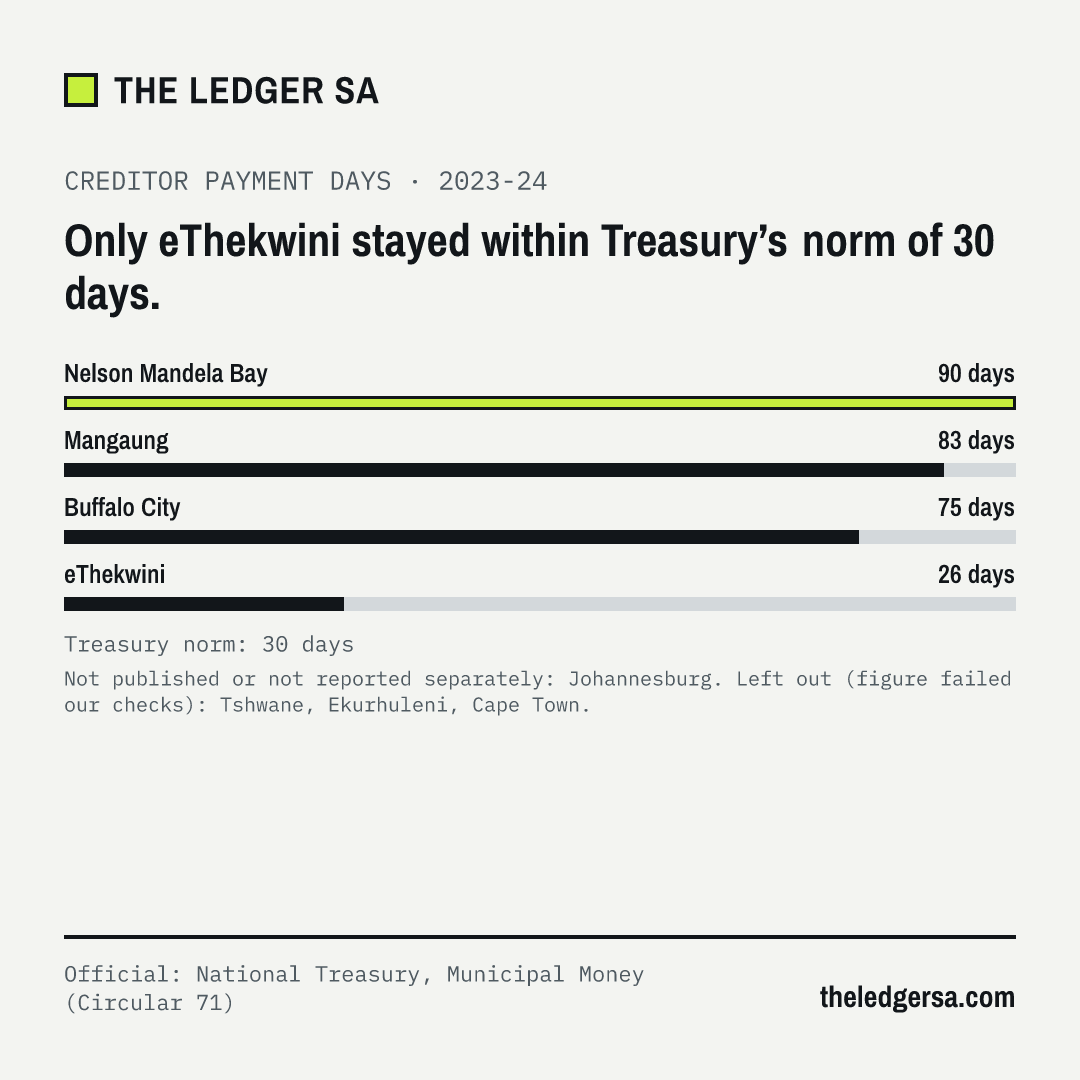
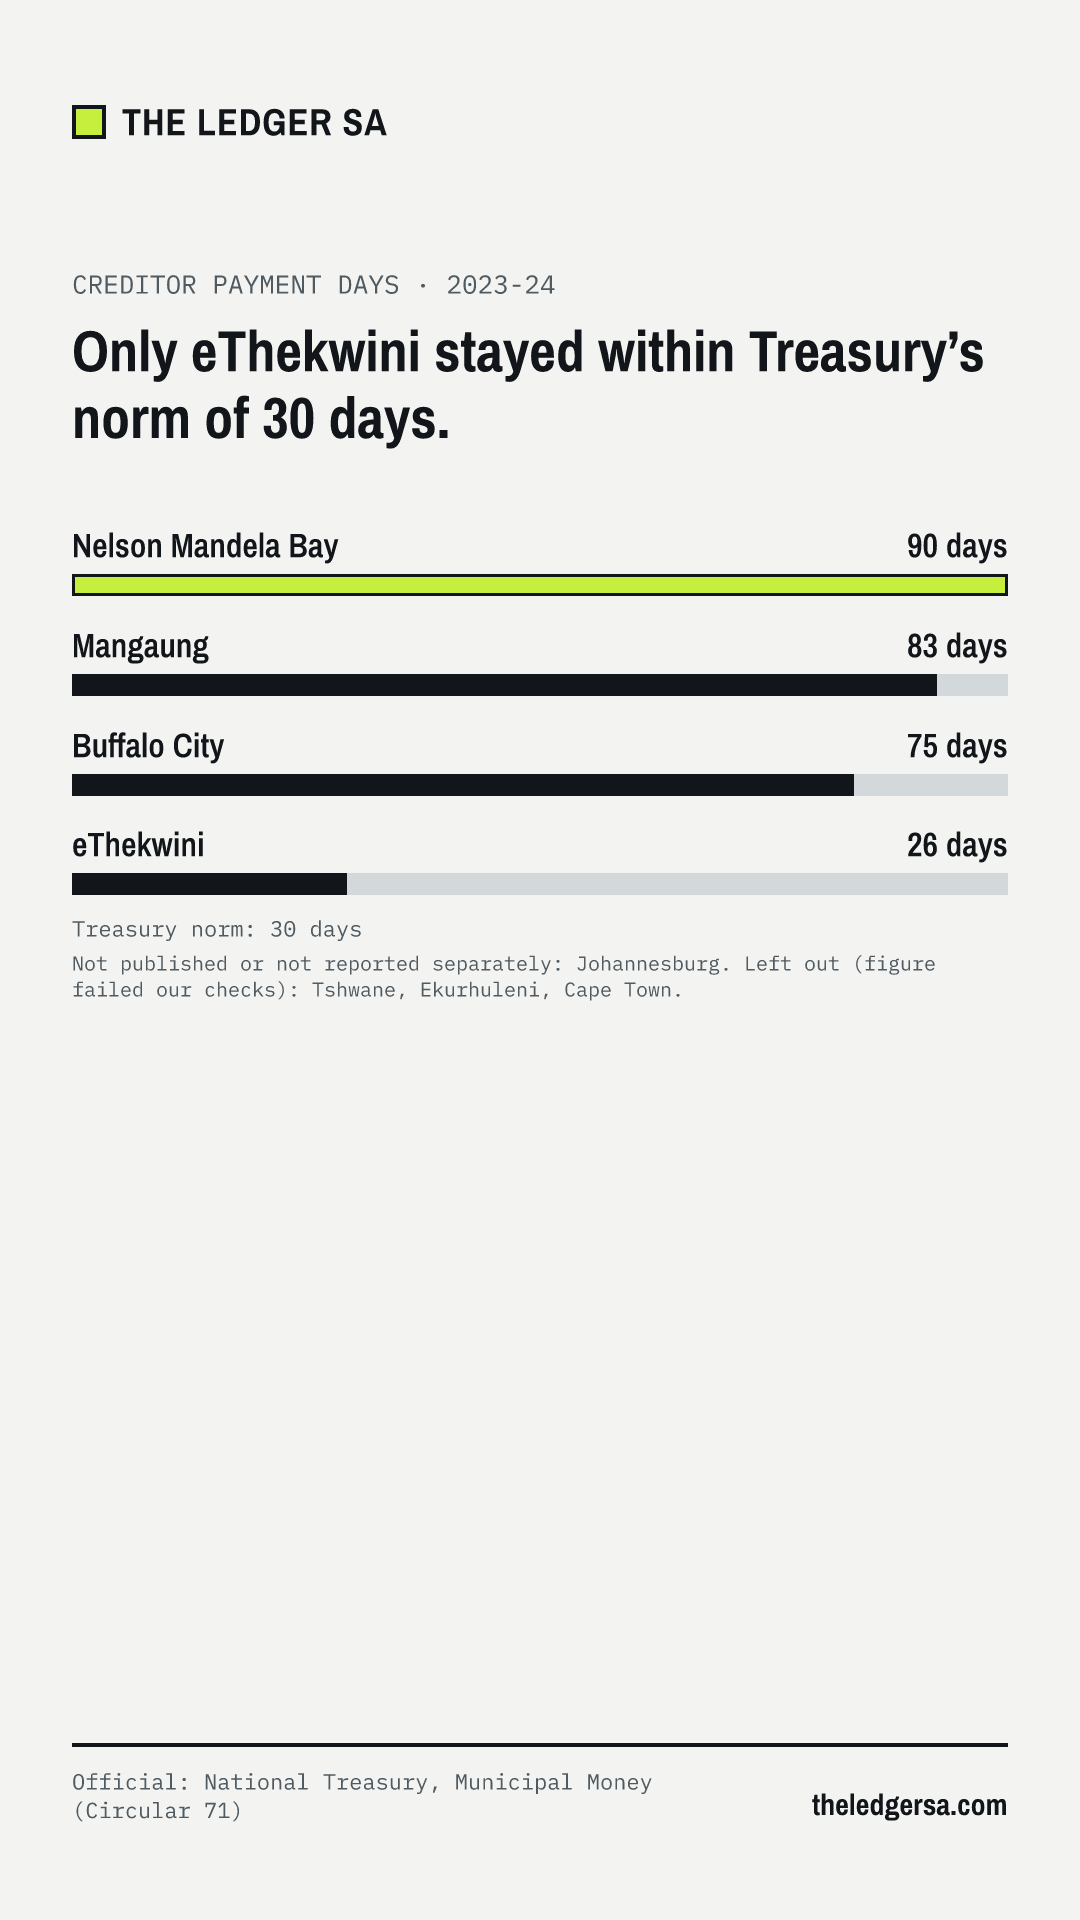
Treasury norm (Circular 71): 30 days. The thin lines on the bars mark it.
Source: National Treasury, Municipal Money. Each figure links to its exact query. Calculated with the Circular 71 formula (see How we work).
*1 As reported to National Treasury. This figure is inconsistent with a metro of this size, which cannot owe its trade creditors nothing at year end (trade creditors reported as zero) and may be a reporting error.
*2 As reported to National Treasury. This figure is inconsistent with the nature of trade creditors, which cannot be negative (reported as R-186,798) and may be a reporting error.
Official: National Treasury, Section 71 (unaudited) · Data as of 30 June 2026 (2025-26, 12 of 12 months, unaudited) · Next update expected November 2026 (Treasury’s next quarterly Section 71 release)
Operating spending as a share of the adjusted budget · 2025-26, 12 months
Official: National Treasury, Section 71 2025-26 quarter 4 (unaudited). Unaudited figures as each metro reported them; audited figures follow about six months after the year ends.
Unaudited: what each metro reported to National Treasury for the full year (preliminary) of 2025-26, to 30 June 2026. The audited years stay the reference; these figures are not used in headlines. Source: Treasury’s summary of metros workbook (all files).