An asterisk marks a figure our automated checks found inconsistent with another official figure. It is shown as reported, explained in a footnote and left out of rankings.
Basic services, 2025
Official: Stats SA, General Household Survey 2025 · Data as of General Household Survey 2025
The newest official figures for each metro: Stats SA’s General Household Survey 2025, a sample survey. Census 2022 is shown beside each as the baseline.
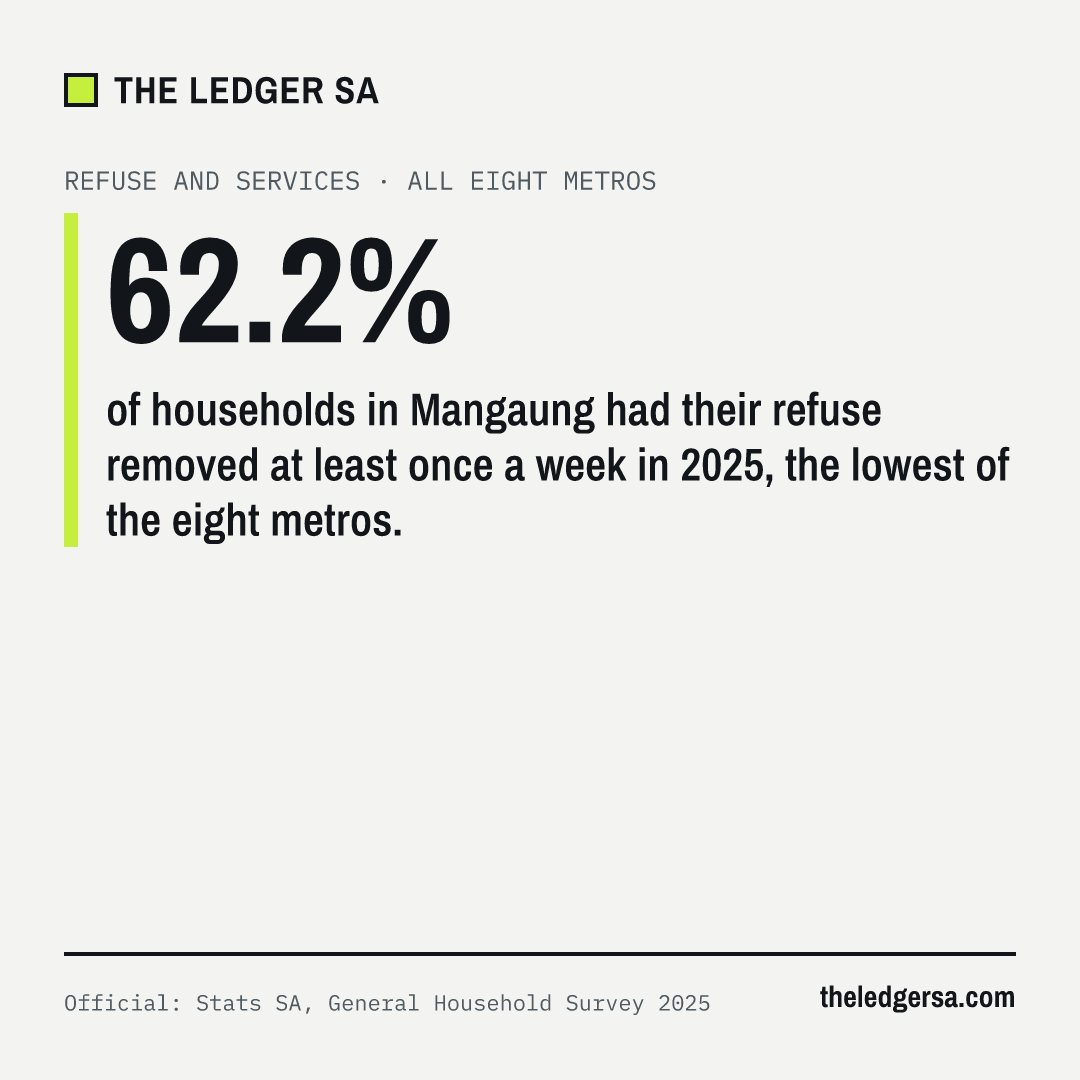
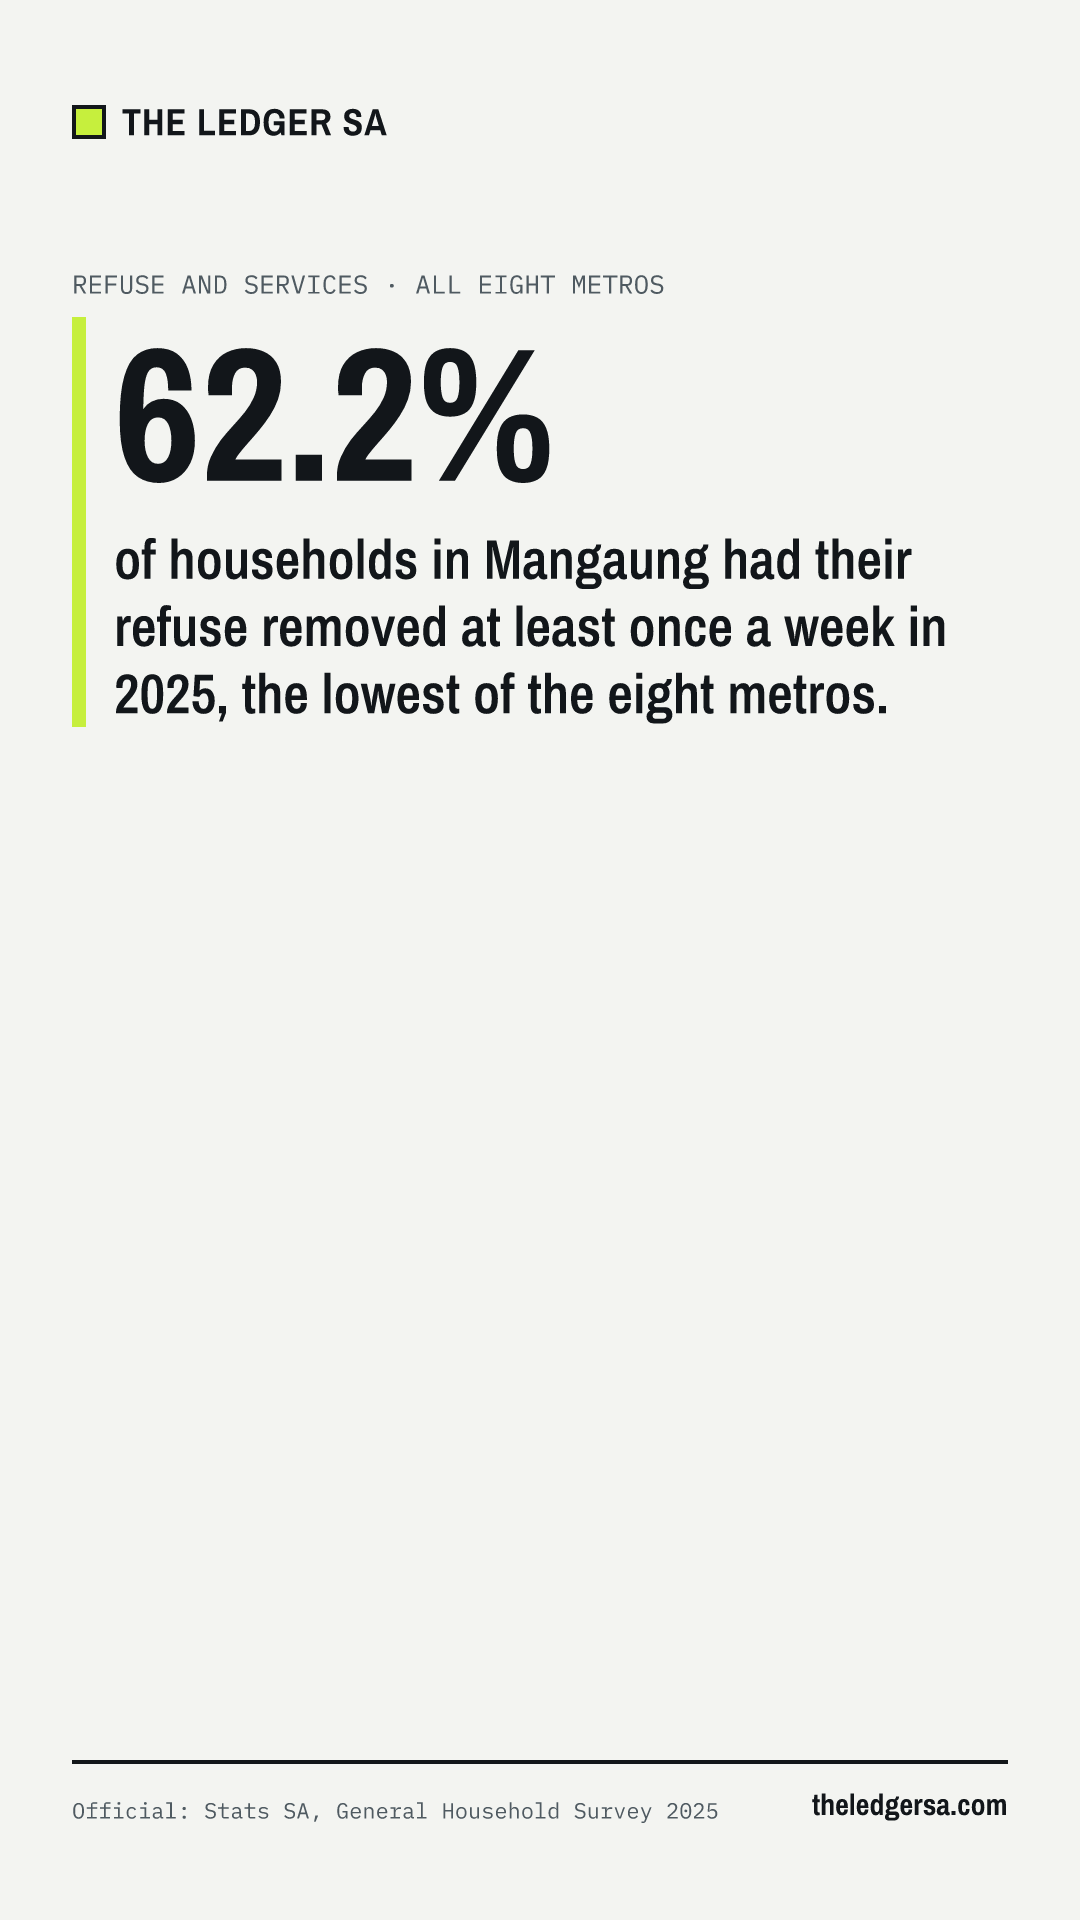
Official: Stats SA, General Household Survey 2025, Table 3.7: MFMA Circular No. 88 metro indicator data elements. Households whose refuse is removed at least once a week, as a share of all households. Grey text: Census 2022 baseline (refuse removed weekly).
Johannesburg53.8%*1not ranked · Census 2022 baseline: 77.1%
Official: Stats SA, General Household Survey 2025, Table 3.7: MFMA Circular No. 88 metro indicator data elements. Households with piped water inside the dwelling, as a share of all households. Grey text: Census 2022 baseline (piped water inside the home).
*1 As reported to Stats SA, General Household Survey 2025. This figure is inconsistent with Census 2022, which found 77.1% (more than 25% away) and may be a reporting error.
Official: Stats SA, General Household Survey 2025, Table 3.7: MFMA Circular No. 88 metro indicator data elements. Households with a flush toilet (sewer or septic tank), as a share of all households. Grey text: Census 2022 baseline (flush toilet).
Official: Stats SA, General Household Survey 2025, Table 3.7: MFMA Circular No. 88 metro indicator data elements. Households with access to electricity, as a share of all households. Grey text: Census 2022 baseline (mains electricity for lighting).
A sample survey: metro figures carry sampling error. Census 2022 is the baseline. The survey asks households, like the census, but a sample of them; small differences between years or metros may not be real. Definitions differ slightly from the census (for example, access to electricity against mains electricity for lighting). Source: Stats SA, GHS 2025: selected development indicators, metros (P0318.3), Table 3.7.
Census 2022 baseline
Official: Statistics South Africa, Census 2022 and Census 2011 · Data as of Census 2022 (census night 2 to 3 February 2022) · Last updated
The census counts every household, so it is the baseline: the share with each service on Census night 2022, against Census 2011. Newer survey figures are above.
Refuse removed by the city at least once a week · Census 2022
Official: Statistics South Africa, Census 2022 and Census 2011. Share of households; grey text is Census 2011.
Census answers are what households told Stats SA, not the metro’s own service records. Stats SA has not published Census 2022 service figures by ward (only population, which each ward page shows), so these are metro totals. For problems in your area now, see the city’s water and power notices and community reports. Source: Stats SA Census 2022 portal, reused with acknowledgement.
Who the metros serve
Official: Stats SA, Non-financial census of municipalities 2023 · Data as of year ended 30 June 2023 · Next update expected 31 Mar 2027 (Stats SA release calendar: 2025)
What each metro reported to Stats SA about its own customers for the year ended 30 June 2023: how many it serves, how many get free basic services, and how many households it lists as indigent (too poor to pay).
Indigent households on the metro’s register · year to June 2023
924 690
Each metro sets its own income cut-off, so the counts are not strictly comparable.
No metro publishes missed refuse collections as data. Residents can report a missed collection in their ward; areas with several reports show on the community reports page and on ward pages. Reports are never used in our rankings or official figures.