Treasury norm: 95%
Share of the rates and service charges billed in the year that was actually collected.
Source: National Treasury, Municipal Money; calculated with the Circular 71 formula.
Money in · Western Cape
Where does the metro’s money come from?
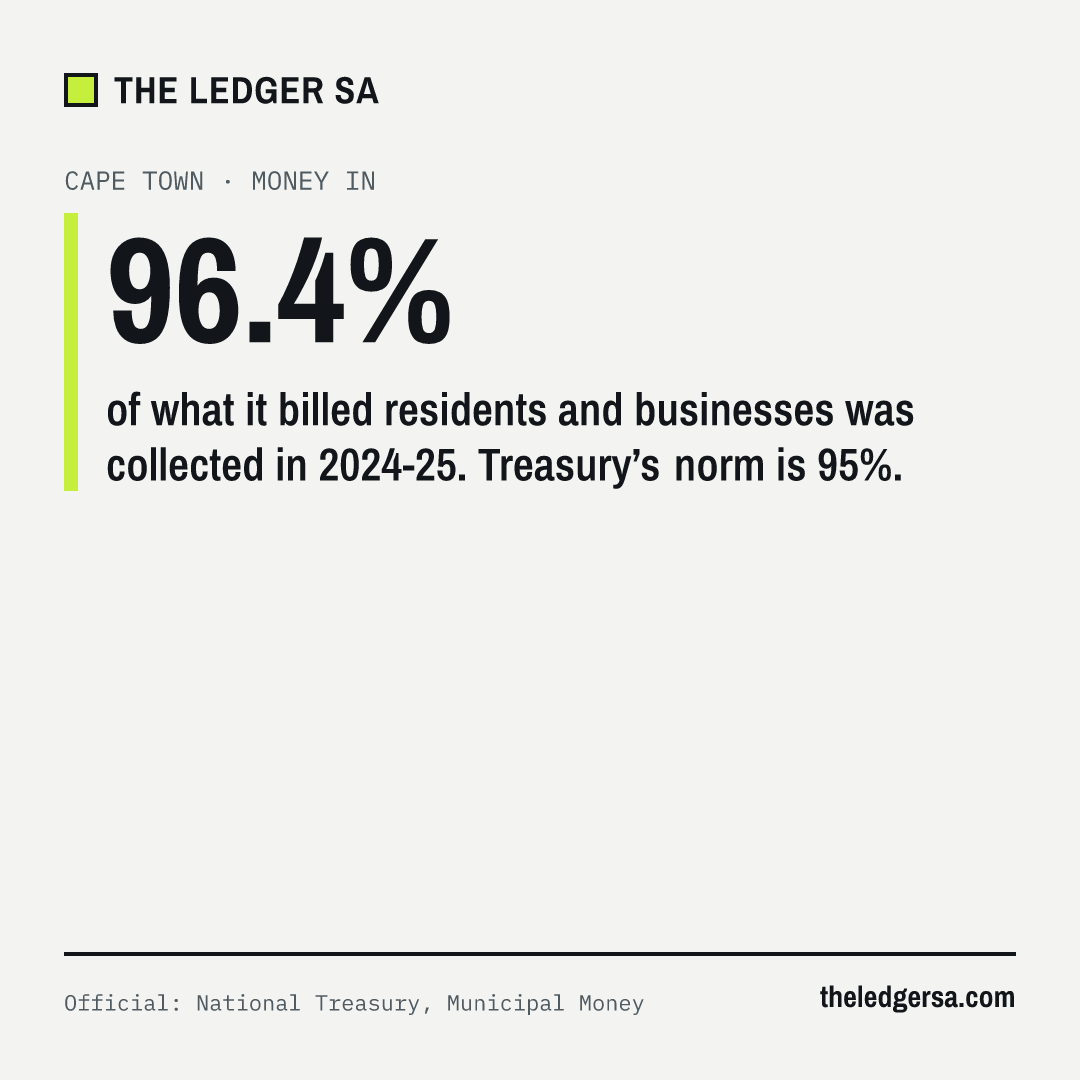
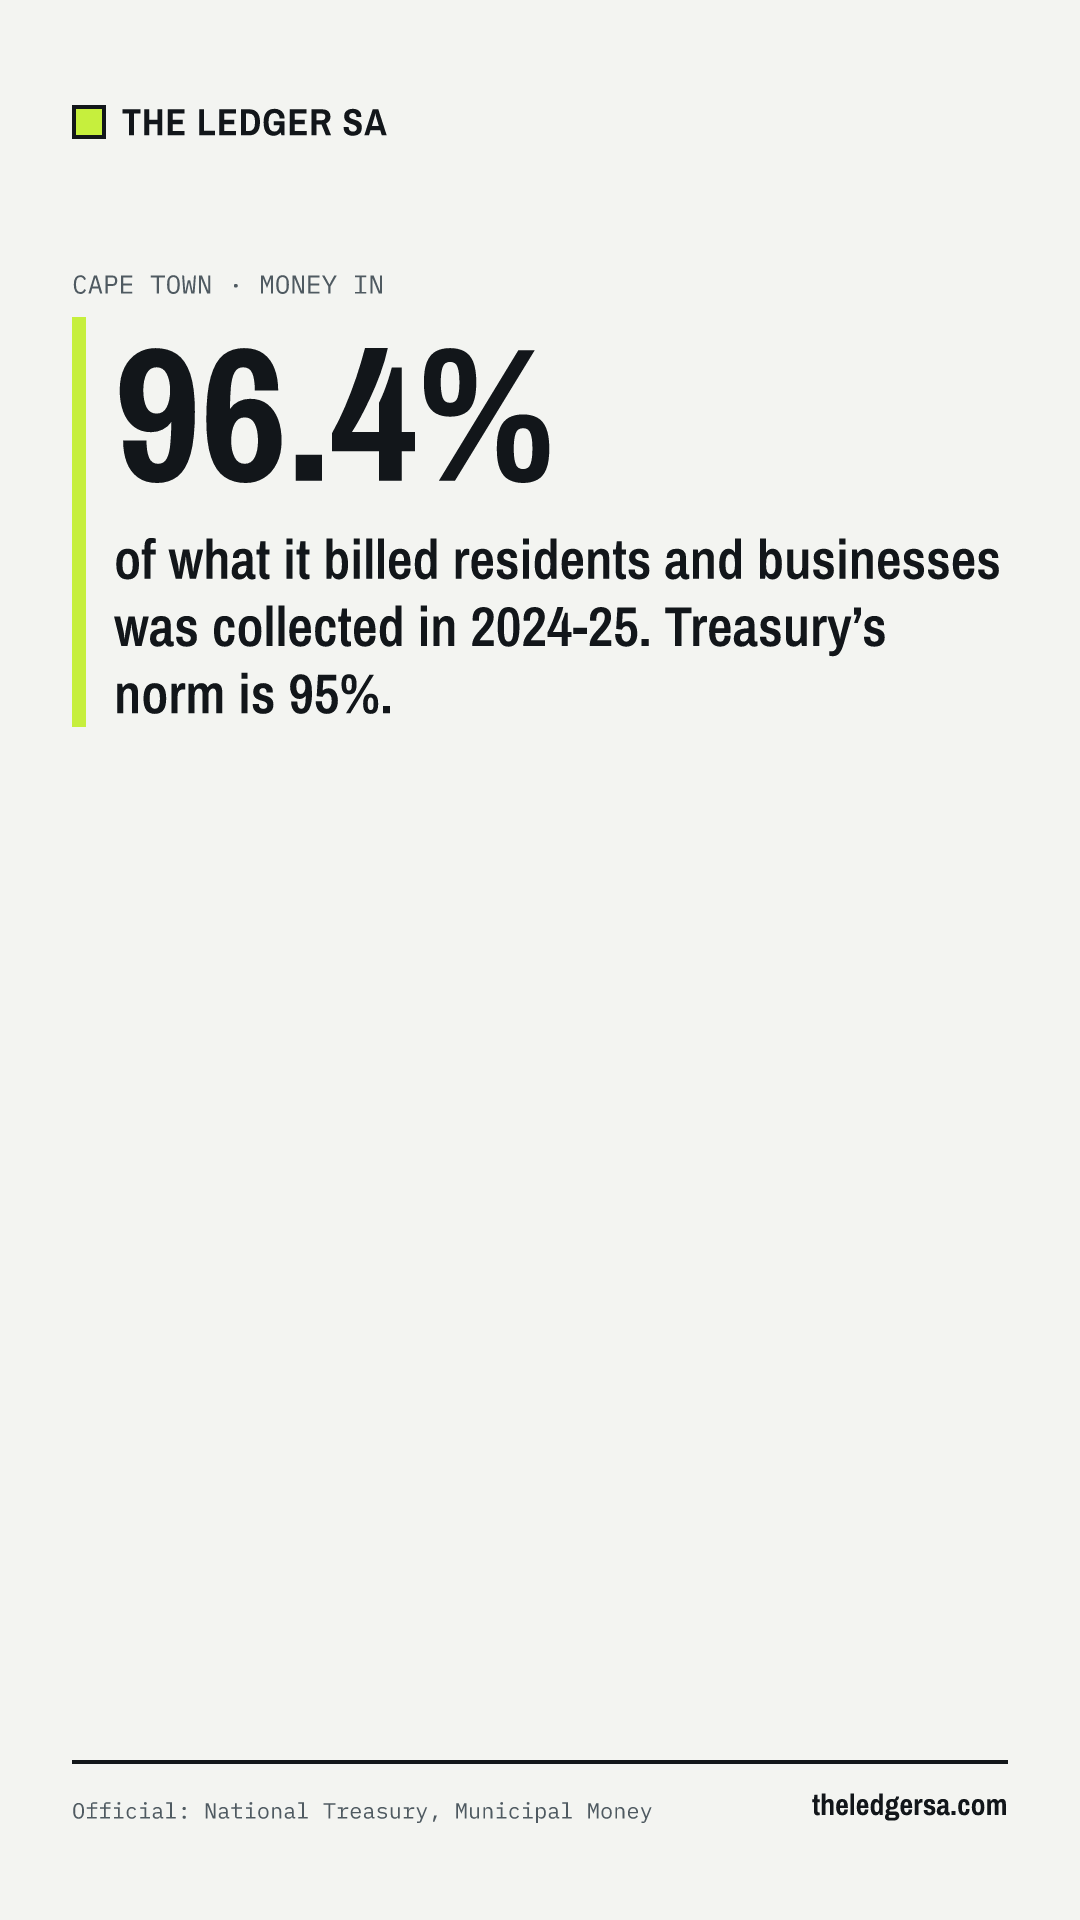
96.4%
of what it billed residents and businesses was collected in 2024-25. Treasury’s norm is 95%.
Official: National Treasury, Municipal Money · Data as of 2024-25 financial year (audited) · Last updated
Compare all eight metros: Money in. An asterisk marks a figure our automated checks found inconsistent with another official figure; it is shown as reported, explained in a footnote and left out of rankings.
Metros do not get income tax or VAT. Those go to national government.
A metro’s own money comes from property rates (a tax on property value) and from selling services: electricity, water, sanitation and refuse removal. On top of that, national government sends grants, mostly for building infrastructure and for free basic services to poor households.
So a metro’s finances depend heavily on one thing: collecting what it bills.
Official: National Treasury · Data as of 2024-25 financial year (audited) · Last updated
Treasury norm: 95%
Share of the rates and service charges billed in the year that was actually collected.
Source: National Treasury, Municipal Money; calculated with the Circular 71 formula.
Official: National Treasury, Section 71 (unaudited) · Data as of 30 June 2026 (2025-26, 12 of 12 months, unaudited) · Next update expected November 2026 (Treasury’s next quarterly Section 71 release)
101%
of the revenue it budgeted for: Cape Town brought in R72.61bn of R71.83bn in the full year (preliminary) of 2025-26, as it reported to Treasury. Residents, businesses and government owed it R9.20bn at 30 June 2026.
Unaudited: what each metro reported to National Treasury for the full year (preliminary) of 2025-26, to 30 June 2026. The audited years stay the reference; these figures are not used in headlines. Source: Treasury’s summary of metros workbook (all files).
Official: National Treasury, Municipal Money (audited) · Data as of 2024-25 financial year (audited) · Last updated
2024-25 R67.47bn · R13 477 per resident
Electricity sales 33% · Everything else 20% · Property rates 19%
2023-24 R61.84bn · R12 562 per resident
Electricity sales 32% · Everything else 19% · Property rates 19%
2022-23 R54.41bn · R11 240 per resident
Electricity sales 30% · Property rates 21% · Everything else 19%
2021-22 R51.81bn · R10 875 per resident
Electricity sales 31% · Property rates 21% · Everything else 19%
2020-21 R43.48bn · R9 260 per resident
Electricity sales 33% · Property rates 24% · Operating grants 13%
Operating revenue, not counting grants for building infrastructure. Per resident uses Stats SA’s mid-year population estimates. Source: National Treasury, Municipal Money, income and expenditure (audited actuals).
Official: National Treasury, Municipal Money (unaudited monthly returns) · Data as of Mar 2026 (unaudited monthly returns) · Updates: Treasury adds months quarterly · Last updated
R9.20bn
owed to Cape Town by residents, businesses and government at the end of Mar 2026; 63% of it was more than 90 days old. The audited figure for June 2025 was R8.67bn.
Households R6.30bn · businesses R1.90bn · government R107.6m · other R887.6m. Source query · audited June 2025.
Official: National Treasury, Municipal Money (unaudited monthly returns) · Data as of Mar 2026 (unaudited monthly returns) · Updates: Treasury adds months quarterly
−R110.0m*
owed by Cape Town to its suppliers at the end of Mar 2026.
* As reported to National Treasury. This figure is inconsistent with the nature of money owed to suppliers, which cannot be negative and may be a reporting error.
Official: SARS and National Treasury · Data as of tax year 2024 (provisional) · Updates: SARS and Treasury publish once a year · Last updated
Metros do not receive income tax or VAT. Income tax goes to national government. Part of national revenue flows back to municipalities as grants: the equitable share and grants for set purposes. A metro’s own money comes from property rates and charges for electricity, water, sanitation and refuse.
The figures below put three things side by side for Cape Town. They cover different periods: a tax year runs from 1 March to the end of February; a municipal year runs from 1 July to 30 June. The periods overlap but are not the same.
Cape Town
975 779 assessed taxpayers · average taxable income R370 992
Income tax: tax year 2024 (1 Mar 2023 to 29 Feb 2024); provisional: The latest tax year in each edition is incomplete: it holds only the assessments finished when SARS extracted the data, and the next edition revises it upwards. We use each tax year from the newest edition that has it. Metro figures: municipal year 2023-24 (1 Jul 2023 to 30 Jun 2024), audited. Own revenue is property rates plus charges for electricity, water, sanitation and refuse. Transfers received are operating and capital transfers from national and provincial government, as recognised in the audited statements. Per resident uses Stats SA’s mid-year population estimate for 2024.
| Tax year | Taxpayers | Taxable income | Tax assessed | Average taxable income |
|---|---|---|---|---|
| 2024 (provisional) | 975 779 | R362.01bn | R79.10bn | R370 992 |
| 2023 | 912 168 | R327.42bn | R71.39bn | R358 942 |
| 2022 | 820 520 | R290.49bn | R64.91bn | R354 027 |
| 2021 | 773 298 | R253.56bn | R55.74bn | R327 894 |
| 2020 | 723 499 | R254.41bn | R58.28bn | R351 645 |
| 2019 | 611 595 | R223.84bn | R51.22bn | R365 993 |
| 2018 | 627 883 | R220.31bn | R49.86bn | R350 878 |
| 2017 | 628 358 | R208.08bn | R45.48bn | R331 144 |
| 2016 | 619 360 | R194.73bn | R42.21bn | R314 404 |
Each tax year is from the newest edition that has it (link on the year). Tax year 2024 is 1 Mar 2023 to 29 Feb 2024, and so on.
| Municipal year | Own revenue | Transfers received |
|---|---|---|
| 2024-25 | R44.60bn | R9.57bn |
| 2023-24 | R40.49bn | R9.26bn |
| 2022-23 | R35.25bn | R8.44bn |
| 2021-22 | R33.63bn | R7.53bn |
| 2020-21 | R30.55bn | R7.60bn |
Sources: SARS and National Treasury, Tax Statistics, Chapter 2 Personal Income Tax, tables A2.10.1 to A2.10.9 (assessed individual taxpayers, by the residential address declared on their tax returns); National Treasury, Municipal Money, income and expenditure (audited). Not published by ward.