Free State
Mangaung
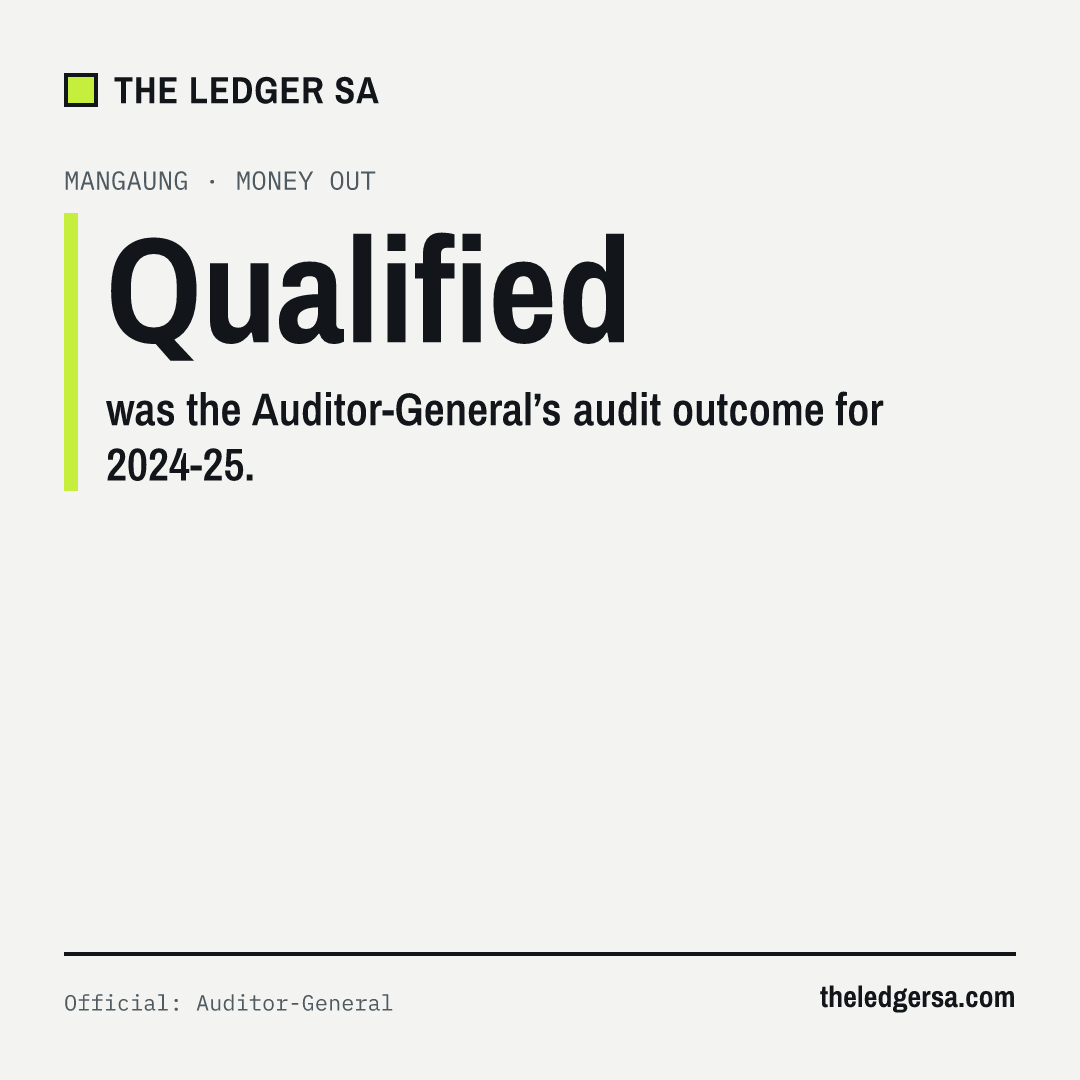
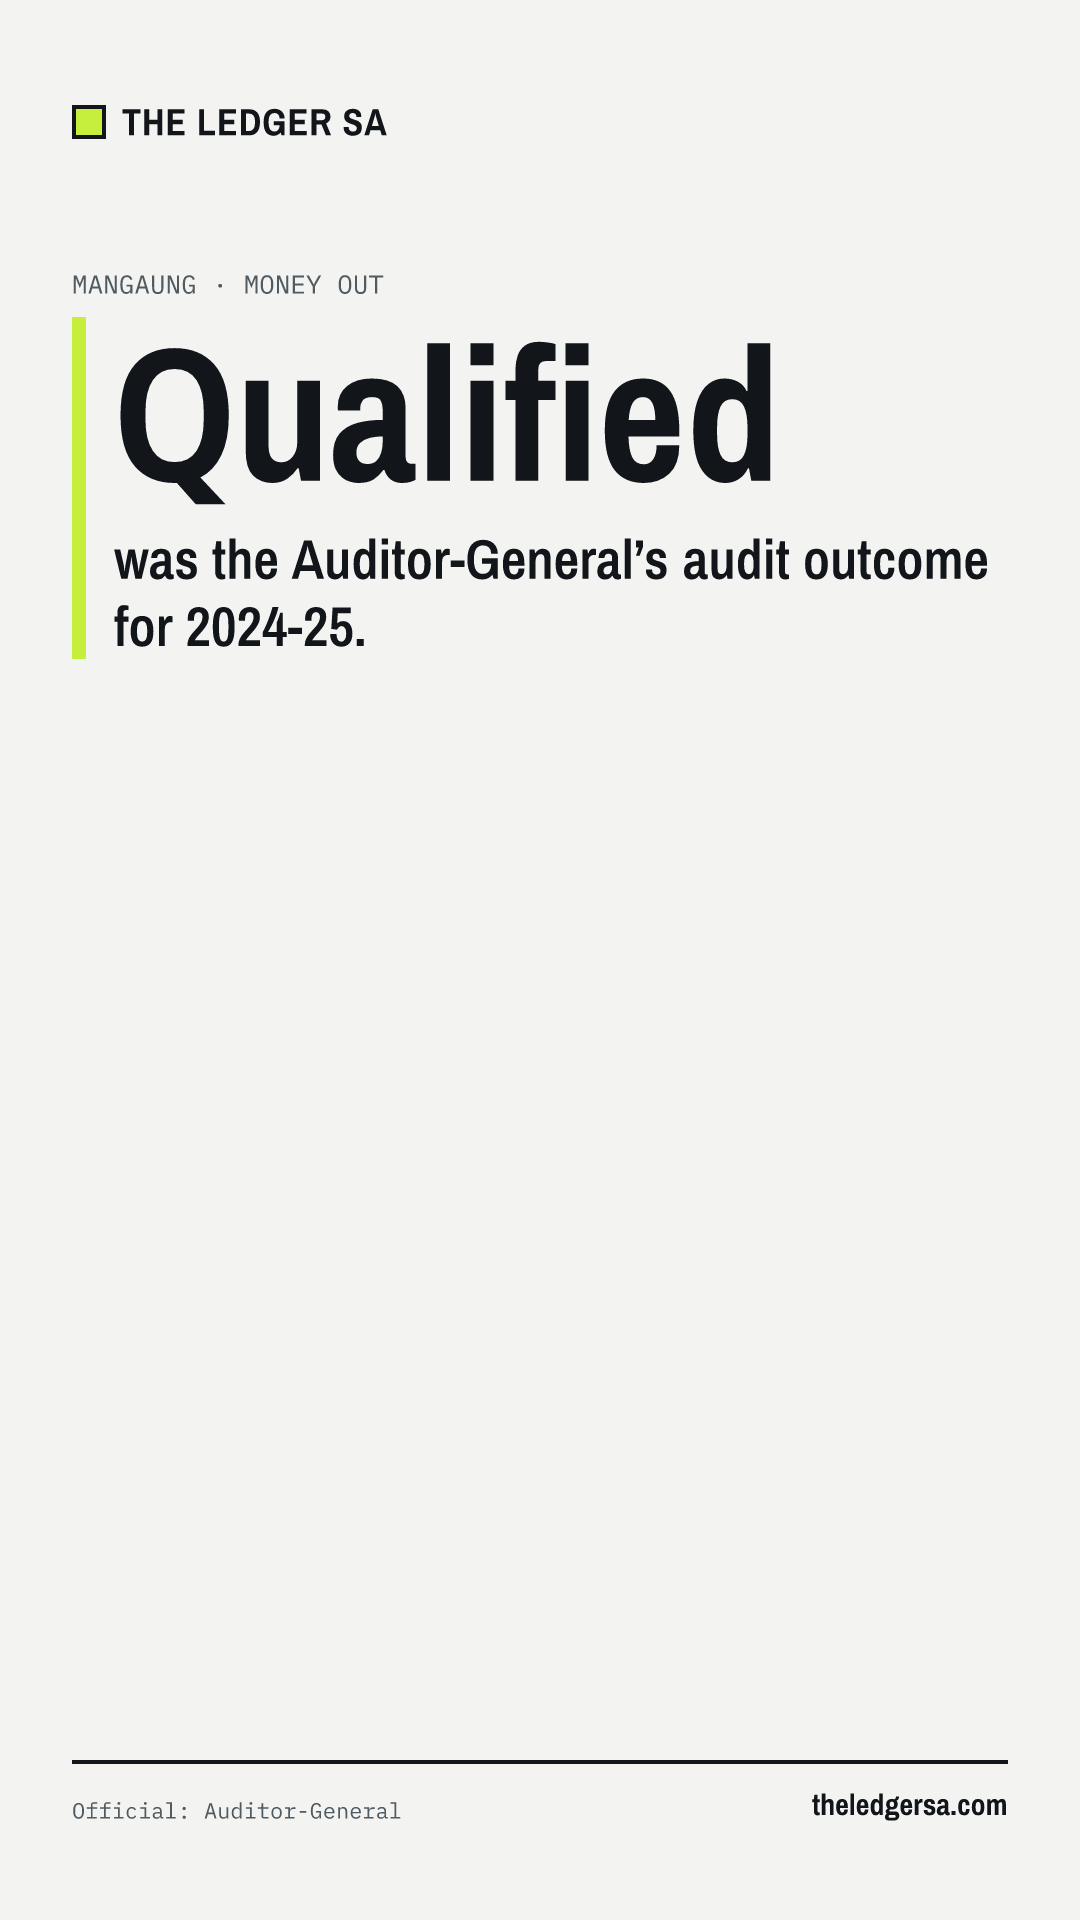
Qualified
was the Auditor-General’s audit outcome for 2024-25.
Official: Auditor-General · Data as of 2024-25 financial year (audited) · Last updated
Mangaung at a glance
Latest official figures
Find your ward in Mangaung
51 wards in Mangaung · 2021 boundaries
Search by name uses the wards of the 2021 local elections; the 2026 elections use new boundaries, and the address search gives both. Each 2021 ward page links to the 2026 wards that cover it. Suburb names are Stats SA Census 2011 sub-places and main places; Census 2022 names have not been published. Voting stations and results: Electoral Commission (IEC). A suburb can span more than one ward.
How Mangaung voted in 2024
Official: Electoral Commission (IEC)
What these words mean
- Voting district
- The area served by one voting station. The Electoral Commission counts and publishes results for each one.
- Turnout
- Votes cast (valid and spoilt) as a share of registered voters.
Mangaung
- ANC 51.3%
- DA 23.5%
- EFF 13.5%
- PA 2.5%
- VF+ 2.2%
- Others 7.0%
Source: Electoral Commission (IEC), 2024 national ballot, results by voting district added up per metro. Turnout counts valid and spoilt votes as a share of registered voters. Shares are of valid votes.