Treasury norm: 95% to 100%
Capital (new, renewed and upgraded assets) spent, as a share of the adjusted capital budget.
Source: National Treasury, Municipal Money; calculated with the Circular 71 formula.
Roads and infrastructure · Eastern Cape
Is the city maintaining and upgrading what it has?
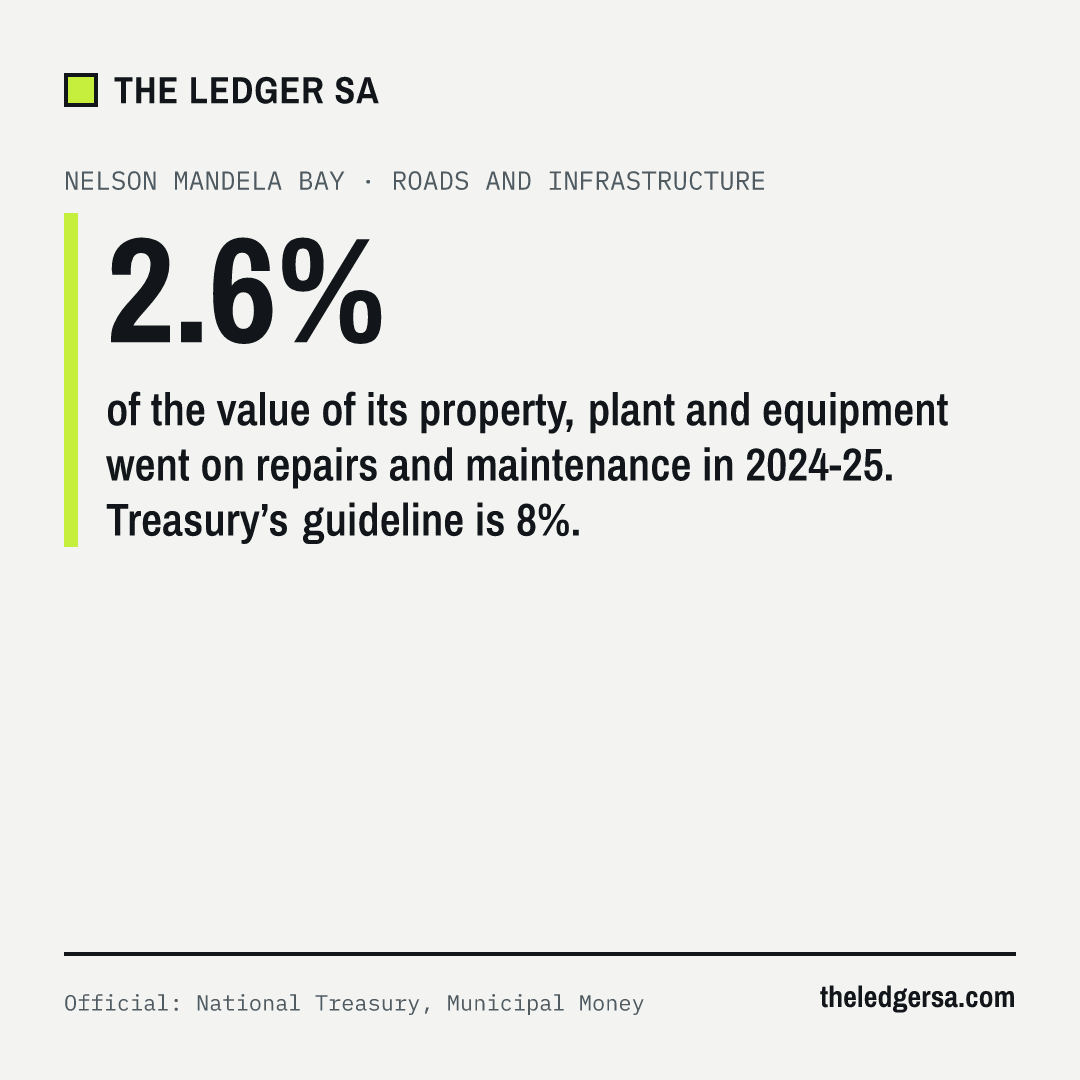
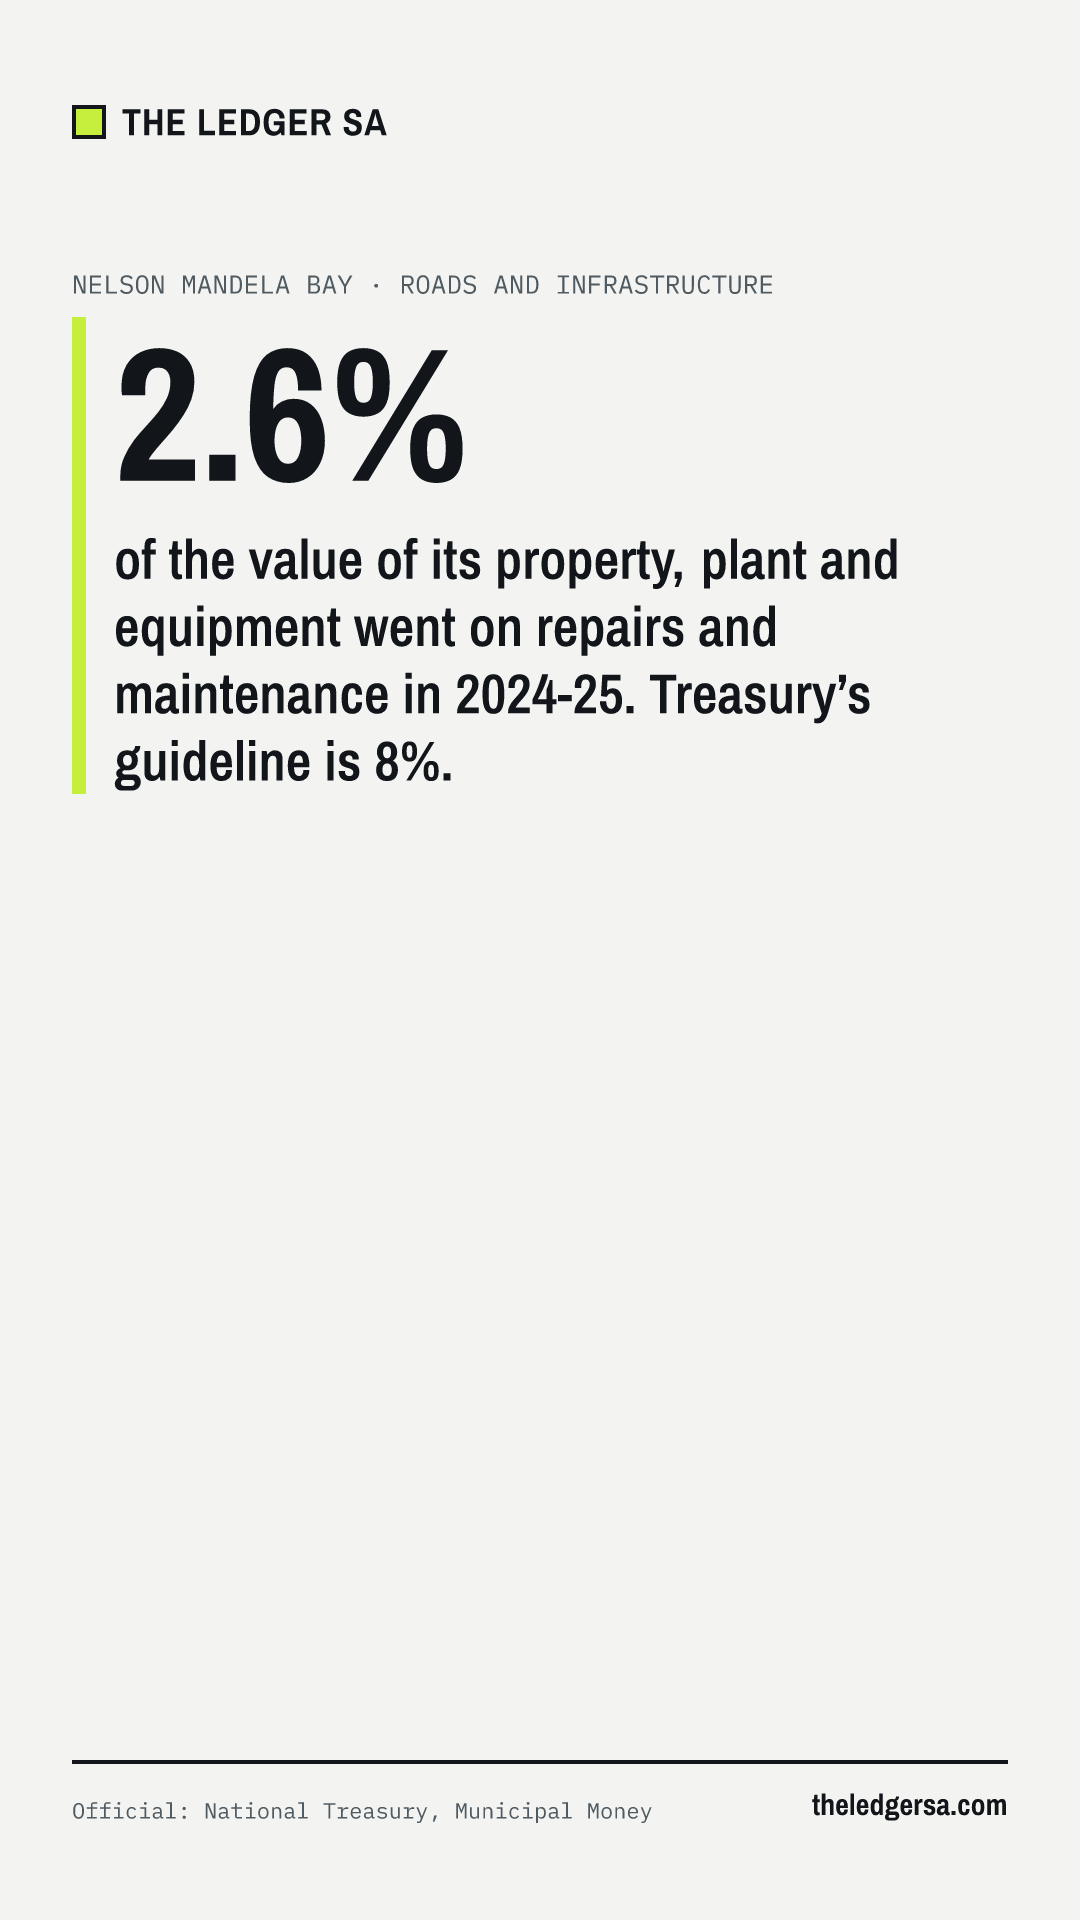
2.6%
of the value of its property, plant and equipment went on repairs and maintenance in 2024-25. Treasury’s guideline is 8%.
Official: National Treasury, Municipal Money · Data as of 2024-25 financial year (audited) · Last updated
Compare all eight metros: Roads and infrastructure. An asterisk marks a figure our automated checks found inconsistent with another official figure; it is shown as reported, explained in a footnote and left out of rankings.
Official: National Treasury · Data as of 2024-25 financial year (audited) · Last updated
Two of Treasury’s norms: spend 95% to 100% of the capital budget (new, renewed and upgraded assets), and spend about 8% of the value of property, plant and equipment on repairs and maintenance each year.
Treasury norm: 95% to 100%
Capital (new, renewed and upgraded assets) spent, as a share of the adjusted capital budget.
Source: National Treasury, Municipal Money; calculated with the Circular 71 formula.
Treasury norm: 8%
Spending on repairs and maintenance as a share of the value of property, plant and equipment.
Source: National Treasury, Municipal Money; calculated with the Circular 71 formula.
Official: National Treasury · Data as of 2024-25 financial year (audited) · Last updated
| Metro | Year to June | Original budget | Adjusted budget | Audited spend | Monthly reports |
|---|---|---|---|---|---|
| Nelson Mandela Bay | 2023 | R1.64bn | R1.83bn | R32.03bn*1 | R1.75bnunaudited, 12 of 12 months |
| Nelson Mandela Bay | 2024 | R2.00bn | R1.81bn | R1.61bn*2 | R1.10bn*3unaudited, 12 of 12 months |
| Nelson Mandela Bay | 2025 | R1.97bn | Not yet published | R1.32bn | Not yet published |
Source: National Treasury, Municipal Money, capital_v2 (new, renewal and upgrading of assets). Each amount links to its exact query. Audited spend is the audited actual. Monthly reports are the sum of the unaudited Section 71 monthly figures, for reference only. Automated checks: audited spend above 1.5 times the original budget, covering fewer than half the functions in the monthly reports, more than 25% away from the sum of 12 monthly reports, or more than 3 times (or under a third of) the year before; monthly figures with a single month above half the annual budget, or a large entry later reversed.
Official: National Treasury, Section 71 (unaudited) · Data as of 30 June 2026 (2025-26, 12 of 12 months, unaudited) · Next update expected November 2026 (Treasury’s next quarterly Section 71 release)
48%*
of its adjusted capital budget: Nelson Mandela Bay spent R1.01bn of R2.12bn in the full year (preliminary) of 2025-26, as it reported to Treasury.
* As reported to National Treasury. This figure is inconsistent with capital spending by source of finance in the same report and may be a reporting error.
Unaudited: what each metro reported to National Treasury for the full year (preliminary) of 2025-26, to 30 June 2026. Capital spending here covers every kind of capital project, so it is wider than the audited “new, renewed and upgraded assets” measure above. The audited years stay the reference; these figures are not used in headlines. Source: Treasury’s summary of metros workbook (all files).
Official: National Treasury, Municipal Money (spending unaudited) · Data as of 2025-26 financial year (spending unaudited) · Last updated
| Year | Allocated | Spent |
|---|---|---|
| 2023-24 | R614.9m | Not reported0 of 12 monthly reports |
| Year | Allocated | Spent |
|---|---|---|
| 2023-24 | R100.4m | Not reported0 of 12 monthly reports |
| Year | Allocated | Spent |
|---|---|---|
| 2023-24 | R29.0m | Not reported0 of 12 monthly reports |
| Year | Allocated | Spent |
|---|---|---|
| 2023-24 | R348.0m | Not reported0 of 12 monthly reports |
| Year | Allocated | Spent |
|---|---|---|
| 2025-26 | R663.8m | Not reported0 of 12 monthly reports |
| Year | Allocated | Spent |
|---|---|---|
| 2025-26 | R298.2m | Not reported0 of 12 monthly reports |
| Year | Allocated | Spent |
|---|---|---|
| 2025-26 | R390.0m | Not reported0 of 12 monthly reports |
USDG: Urban Settlements Development Grant (land, services and housing). PTNG: Public Transport Network Grant (bus rapid transit and other public transport). NDPG: Neighbourhood Development Partnership Grant. RBIG: Regional Bulk Infrastructure Grant (bulk water and sanitation). Spending is what the metro reported each month, added up; fewer than 12 reports means part of the year is missing, and one report can hold a whole year. Treasury’s dataset has no 2024-25 grant figures. Source: National Treasury, Municipal Money, grants.